
Dashboard
The company is Net-Debt Free
Healthy long term growth as Net Sales has grown by an annual rate of 19.39% and Operating profit at 17.51%
Positive results in Mar 26
With ROE of 9.1, it has a Very Attractive valuation with a 0.2 Price to Book Value
Despite the size of the company, domestic mutual funds hold only 0% of the company
Stock DNA
IT - Software
INR 2,008 Cr (Small Cap)
2.00
20
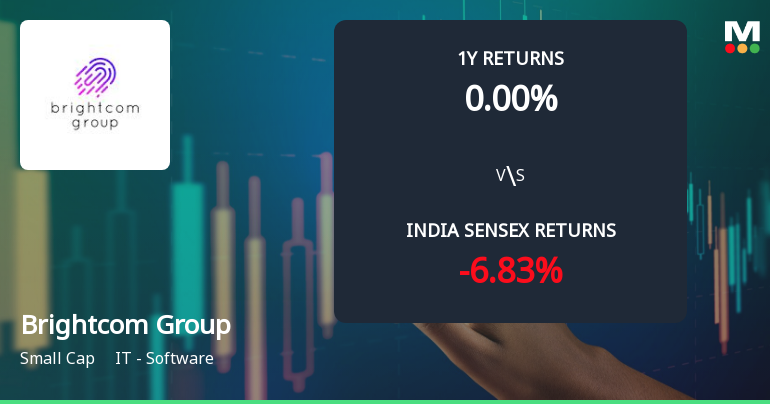
0.00%
-0.13
9.10%
0.19
Total Returns (Price + Dividend) 
Latest dividend: 0.3 per share ex-dividend date: Sep-22-2022
Risk Adjusted Returns v/s
Returns Beta

News
Brightcom Group Ltd Technical Momentum Shifts Amid Bearish Signals
Brightcom Group Ltd has experienced a notable shift in its technical momentum, transitioning from a sideways trend to a mildly bearish stance. Recent technical indicators reveal a complex interplay of bullish and bearish signals, prompting a downgrade in its Mojo Grade from Buy to Hold as of 4 June 2026, reflecting cautious investor sentiment amid price weakness and mixed momentum cues.
Read full news article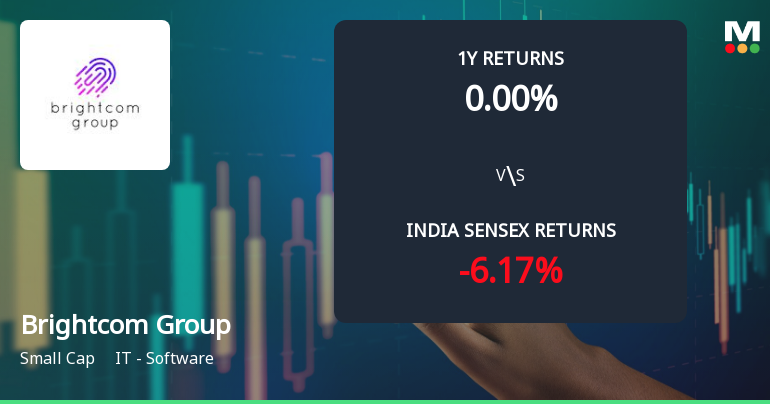
Brightcom Group Ltd Technical Momentum Shifts Amid Sideways Trend
Brightcom Group Ltd has experienced a notable shift in its technical momentum, moving from a mildly bullish stance to a more sideways trend, reflecting a period of consolidation after recent volatility. Despite a modest decline in price, key technical indicators present a mixed picture, signalling caution for investors amid evolving market dynamics.
Read full news article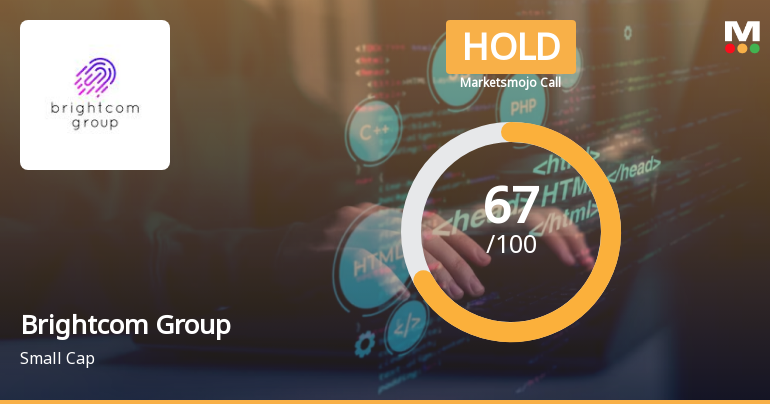
Brightcom Group Ltd is Rated Hold
Brightcom Group Ltd is rated 'Hold' by MarketsMOJO, with this rating last updated on 8 June 2026. While the rating change occurred on that date, the analysis and financial metrics discussed here reflect the stock's current position as of 24 June 2026, providing investors with the latest insights into the company’s performance and outlook.
Read full news article Announcements
Announcement under Regulation 30 (LODR)-Investor Presentation
19-Jun-2026 | Source : BSEInvestor presentation
Closure of Trading Window
16-Jun-2026 | Source : BSEIntimation of Closure of Trading Window from 1st July till 48 hours
Intimation Of Shareholder Confrence Call
08-Jun-2026 | Source : BSEIntimation of Shareholder Confrence call to be held on 14th June 2026
Corporate Actions

No Upcoming Board Meetings

Brightcom Group Ltd has declared 15% dividend, ex-date: 22 Sep 22

No Splits history available

Brightcom Group Ltd has announced 2:3 bonus issue, ex-date: 15 Mar 22

No Rights history available
Quality key factors
Valuation key factors
Technicals key factors
 Technical Indicator Scale: Bearish, Mildly Bearish, Sideways, Mildly Bullish, Bullish Turned
 Shareholding Snapshot : Mar 2026
Shareholding Compare (%holding)
Non Institution
1.0845
Held by 0 Schemes
Held by 42 FIIs (1.28%)
Aradhana Commosales Llp (5.16%)
National Stock Exchange Of India Limited Account Fpi (3.3%)
68.32%
Quarterly Results Snapshot (Consolidated) - Mar'26 - QoQ

QoQ Growth in quarter ended Mar 2026 is -28.46% vs 35.76% in Dec 2025
QoQ Growth in quarter ended Mar 2026 is -33.09% vs 33.29% in Dec 2025
Half Yearly Results Snapshot (Consolidated) - Sep'25

Growth in half year ended Sep 2025 is 24.72% vs -29.08% in Sep 2024
Growth in half year ended Sep 2025 is 28.37% vs -48.67% in Sep 2024
Nine Monthly Results Snapshot (Consolidated) - Dec'25
YoY Growth in nine months ended Dec 2025 is 28.18% vs 5.09% in Dec 2024
YoY Growth in nine months ended Dec 2025 is 28.02% vs -9.25% in Dec 2024
Annual Results Snapshot (Consolidated) - Mar'26
YoY Growth in year ended Mar 2026 is 34.61% vs 10.39% in Mar 2025
YoY Growth in year ended Mar 2026 is 35.53% vs 3.28% in Mar 2025
About Brightcom Group Ltd

Company Coordinates


