
Compare KDDL Ltd with Similar Stocks
Dashboard
Strong ability to service debt as the company has a low Debt to EBITDA ratio of 1.66 times
Healthy long term growth as Net Sales has grown by an annual rate of 31.44% and Operating profit at 58.02%
The company has declared positive results in Mar'2026 after 2 consecutive negative quarters
With ROE of 8.3, it has a Expensive valuation with a 3.4 Price to Book Value
Despite the size of the company, domestic mutual funds hold only 0% of the company
Market Beating performance in long term as well as near term
Stock DNA
Gems, Jewellery And Watches
INR 3,984 Cr (Small Cap)
41.00
32
0.67%
-0.21
8.32%
3.39
Total Returns (Price + Dividend) 
Latest dividend: 15.123226749572774 per share ex-dividend date: Nov-14-2025
Risk Adjusted Returns v/s
Returns Beta

News
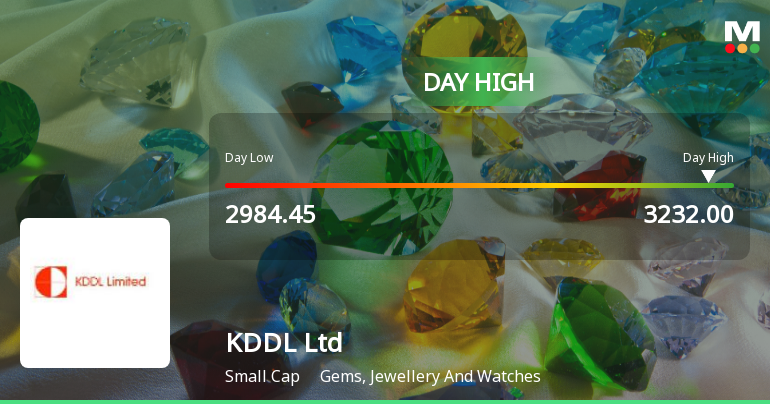
KDDL Ltd Surges 8.05% to Day's High of Rs 3185 — Outperforms Sector by 6.95 Percentage Points
The Sensex advanced 0.59% on 22 Jun 2026, yet KDDL Ltd outpaced the broader market with an 8.05% gain, reaching an intraday high of Rs 3185. This 6.95-percentage-point outperformance over its Gems, Jewellery And Watches sector peers marks a notable single-session surge that demands a closer look at the underlying technical and market context.
Read full news article
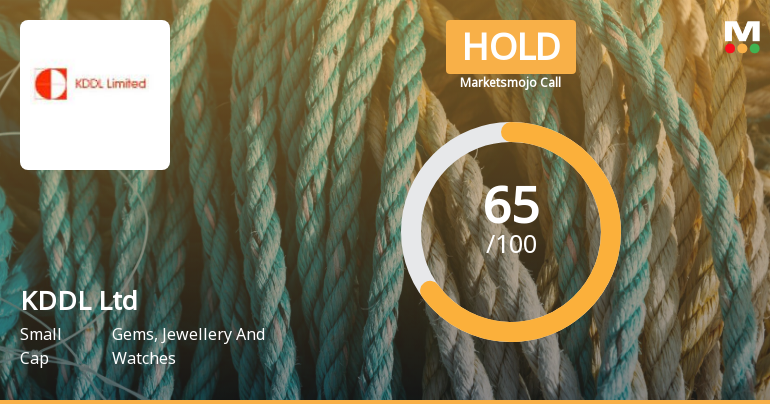
KDDL Ltd is Rated Hold by MarketsMOJO
KDDL Ltd is rated 'Hold' by MarketsMOJO, with this rating last updated on 05 June 2026. However, the analysis and financial metrics discussed here reflect the company’s current position as of 19 June 2026, providing investors with an up-to-date view of the stock’s fundamentals, returns, and technical outlook.
Read full news article Announcements
Compliances-Reg.24(A)-Annual Secretarial Compliance
30-May-2026 | Source : BSEReport
Announcement under Regulation 30 (LODR)-Earnings Call Transcript
26-May-2026 | Source : BSEEarnings Call Transcript
Announcement under Regulation 30 (LODR)-Analyst / Investor Meet - Outcome
21-May-2026 | Source : BSEEarnings Call Recording
Corporate Actions

No Upcoming Board Meetings

KDDL Ltd has declared 150% dividend, ex-date: 14 Nov 25

No Splits history available

No Bonus history available

KDDL Ltd has announced 7:75 rights issue, ex-date: 30 Mar 21
Quality key factors
Valuation key factors
Technicals key factors
 Technical Indicator Scale: Bearish, Mildly Bearish, Sideways, Mildly Bullish, Bullish Turned
 Shareholding Snapshot : Mar 2026
Shareholding Compare (%holding)
Promoters
None
Held by 1 Schemes (0.0%)
Held by 50 FIIs (8.16%)
Yashovardhan Saboo (14.65%)
Asha Mukul Agrawal (3.44%)
33.9%
Quarterly Results Snapshot (Consolidated) - Mar'26 - YoY

YoY Growth in quarter ended Mar 2026 is 37.04% vs 20.70% in Mar 2025
YoY Growth in quarter ended Mar 2026 is 24.62% vs -20.57% in Mar 2025
Half Yearly Results Snapshot (Consolidated) - Sep'25
Growth in half year ended Sep 2025 is 29.81% vs 12.67% in Sep 2024
Growth in half year ended Sep 2025 is -4.83% vs -18.35% in Sep 2024
Nine Monthly Results Snapshot (Consolidated) - Dec'25
YoY Growth in nine months ended Dec 2025 is 28.51% vs 17.72% in Dec 2024

YoY Growth in nine months ended Dec 2025 is -15.48% vs -3.64% in Dec 2024
Annual Results Snapshot (Consolidated) - Mar'26
YoY Growth in year ended Mar 2026 is 30.68% vs 18.46% in Mar 2025
YoY Growth in year ended Mar 2026 is -6.89% vs -7.85% in Mar 2025
About KDDL Ltd

Company Coordinates


