
Compare Shetron with Similar Stocks
Dashboard
Weak Long Term Fundamental Strength with a 12.04% CAGR growth in Operating Profits over the last 5 years
- Company's ability to service its debt is weak with a poor EBIT to Interest (avg) ratio of 1.66
- The company has been able to generate a Return on Equity (avg) of 9.35% signifying low profitability per unit of shareholders funds
Flat results in Mar 26
Below par performance in long term as well as near term
Total Returns (Price + Dividend) 
Latest dividend: 1 per share ex-dividend date: Aug-29-2025
Risk Adjusted Returns v/s
Returns Beta

News
Shetron Ltd is Rated Strong Sell
Shetron Ltd is rated Strong Sell by MarketsMOJO, with this rating last updated on 04 May 2026. However, the analysis and financial metrics presented here reflect the company’s current position as of 28 June 2026, providing investors with an up-to-date view of the stock’s fundamentals, returns, and market performance.
Read full news article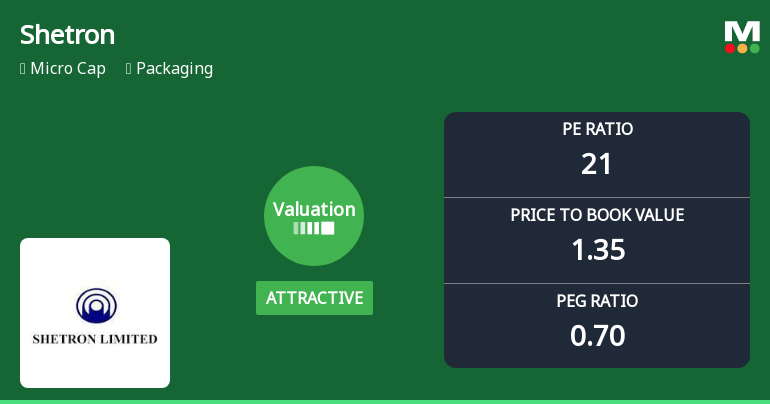
Shetron Ltd Valuation Shifts Signal Changing Market Sentiment in Packaging Sector
Shetron Ltd, a micro-cap player in the packaging industry, has witnessed a notable shift in its valuation parameters, moving from a very attractive to an attractive rating. This change reflects evolving market perceptions and invites a closer examination of its price-to-earnings (P/E) and price-to-book value (P/BV) ratios relative to historical trends and peer benchmarks.
Read full news article
Shetron Ltd is Rated Strong Sell
Shetron Ltd is rated Strong Sell by MarketsMOJO, with this rating last updated on 04 May 2026. However, the analysis and financial metrics discussed here reflect the stock’s current position as of 17 June 2026, providing investors with the most recent and relevant data to assess the company’s outlook.
Read full news article Announcements
Closure of Trading Window
24-Jun-2026 | Source : BSEAs per the Companys Code of Conduct for Prohibition of Insider Trading framed pursuant to SEBI (Prohibition of Insider Trading) Regulations 2015 and amended from time to time the Trading Window for dealing in securities of the Company shall remain closed from Wednesday 1st July 2026 till the expiry of 48 hours after declaration of the Unaudited Financial Results of the Company for the quarter ended 30th June 2026. During the aforesaid closed Trading Window period the Employees Directors Key Managerial Personnel Promoters Designated Person and their immediate relatives or any other insider shall not trade in the Companys Shares/Securities. The date of Board Meeting for declaration of the financial results of the Company for the quarter ended 30th June 2026 will be intimated in due course.
Compliances-Reg.24(A)-Annual Secretarial Compliance
28-May-2026 | Source : BSEAnnual Secretarial Compliance Report for the Financial Year ended 31st March 2026
Announcement under Regulation 30 (LODR)-Change in Management
02-May-2026 | Source : BSEChange in Management
Corporate Actions

No Upcoming Board Meetings

Shetron Ltd has declared 10% dividend, ex-date: 29 Aug 25

No Splits history available

No Bonus history available

No Rights history available
Quality key factors
Valuation key factors
Technicals key factors
 Technical Indicator Scale: Bearish, Mildly Bearish, Sideways, Mildly Bullish, Bullish Turned
 Shareholding Snapshot : Mar 2026
Shareholding Compare (%holding)
Promoters
None
Held by 1 Schemes (0.0%)
Held by 0 FIIs
Diwakar Sanku Shetty (25.24%)
Hitesh Ramji Javeri (5.01%)
32.15%
Quarterly Results Snapshot (Standalone) - Mar'26 - YoY

YoY Growth in quarter ended Mar 2026 is 12.49% vs 5.84% in Mar 2025
YoY Growth in quarter ended Mar 2026 is 284.00% vs -77.68% in Mar 2025
Half Yearly Results Snapshot (Standalone) - Sep'25
Growth in half year ended Sep 2025 is 5.49% vs -11.45% in Sep 2024
Growth in half year ended Sep 2025 is 1.52% vs -27.95% in Sep 2024
Nine Monthly Results Snapshot (Standalone) - Dec'25
YoY Growth in nine months ended Dec 2025 is 6.06% vs -7.45% in Dec 2024
YoY Growth in nine months ended Dec 2025 is 7.42% vs -47.69% in Dec 2024
Annual Results Snapshot (Standalone) - Mar'26
YoY Growth in year ended Mar 2026 is 7.59% vs -4.60% in Mar 2025
YoY Growth in year ended Mar 2026 is 29.87% vs -52.83% in Mar 2025
About Shetron Ltd

Company Coordinates


