
Compare Shetron with Similar Stocks
Dashboard
Weak Long Term Fundamental Strength with a 12.04% CAGR growth in Operating Profits over the last 5 years
- Company's ability to service its debt is weak with a poor EBIT to Interest (avg) ratio of 1.66
- The company has been able to generate a Return on Equity (avg) of 9.35% signifying low profitability per unit of shareholders funds
Flat results in Mar 26
Below par performance in long term as well as near term
Total Returns (Price + Dividend) 
Latest dividend: 1 per share ex-dividend date: Aug-29-2025
Risk Adjusted Returns v/s
Returns Beta

News
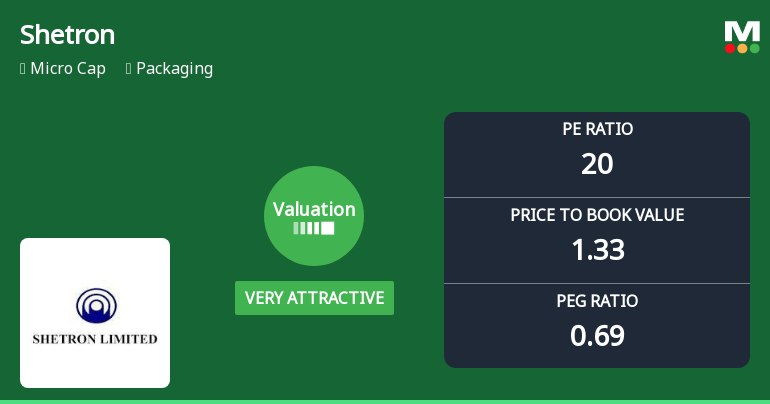
Shetron Ltd Valuation Shifts to Very Attractive Amid Mixed Market Performance
Shetron Ltd, a micro-cap player in the packaging sector, has witnessed a notable shift in its valuation parameters, moving from an attractive to a very attractive rating. Despite recent share price declines and a challenging market environment, the company’s improved price-to-earnings and price-to-book ratios suggest a potential opportunity for value-oriented investors seeking exposure in the packaging industry.
Read full news article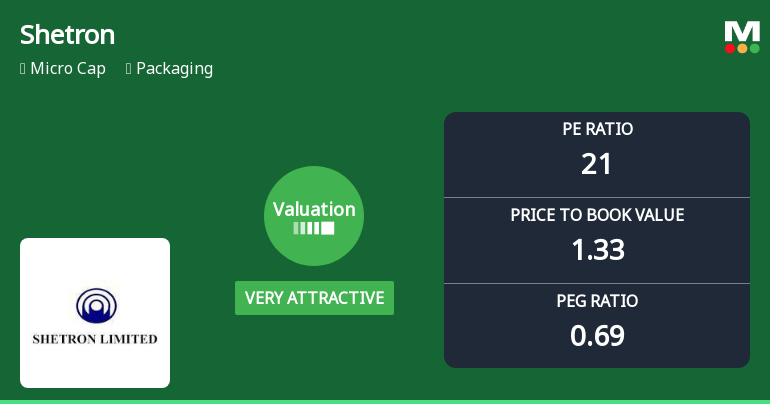
Shetron Ltd Valuation Shifts Signal Renewed Price Attractiveness Amid Market Challenges
Shetron Ltd, a micro-cap player in the packaging sector, has witnessed a notable improvement in its valuation parameters, shifting from an attractive to a very attractive rating. Despite recent share price declines and a challenging market backdrop, the company’s price-to-earnings (P/E) and price-to-book value (P/BV) ratios now present a compelling case for investors seeking value in the packaging industry.
Read full news article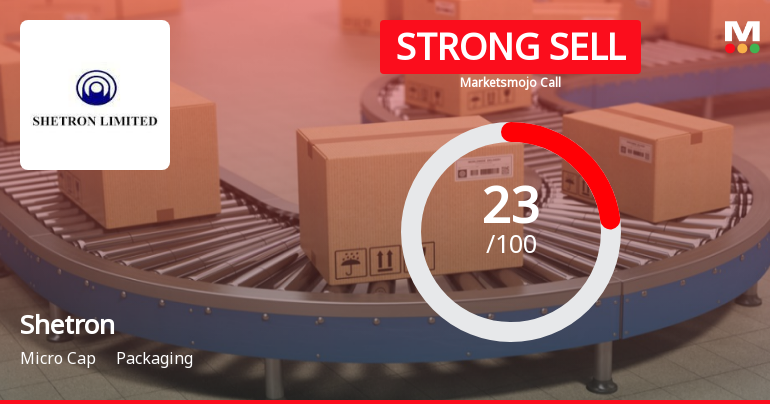
Shetron Ltd is Rated Strong Sell
Shetron Ltd is rated Strong Sell by MarketsMOJO, with this rating last updated on 04 May 2026. However, the analysis below reflects the stock’s current position as of 09 July 2026, incorporating the latest fundamentals, returns, and financial metrics to provide investors with an up-to-date perspective.
Read full news article Announcements
Compliances-Certificate under Reg. 74 (5) of SEBI (DP) Regulations 2018
11-Jul-2026 | Source : BSEIn compliance with Regulation 74(5) of SEBI (Depositories and Participants) Regulations 2018 we are forwarding herewith a copy of the certificate received from Integrated Registry Management Services Private Limited the Registrar and Share Transfer Agent of the Company for the quarter ended 30th June 2026.
Announcement under Regulation 30 (LODR)-Newspaper Publication
07-Jul-2026 | Source : BSEThis is to inform you about the newspaper advertisement with respect to Notice of Annual General Meeting E-voting and Book Closure published in Financial Express (English edition) and Sanjevani (Kannada edition).
Reg. 34 (1) Annual Report.
06-Jul-2026 | Source : BSEPursuant to the provisions of Regulation 34 of Securities and Exchange Board of India (Listing Obligations and Disclosure Requirements) Regulations 2015 please find enclosed the copy of Annual Report along with the notice of Forty Sixth (46th) Annual General Meeting of the Company to be held at 11:00 AM on Friday the 31st day of July 2026 through Video Conference (VC) or Other Audio Visual Means (OAVM) as per the Companies Act 2013.
Corporate Actions

No Upcoming Board Meetings

Shetron Ltd has declared 10% dividend, ex-date: 24 Jul 26

No Splits history available

No Bonus history available

No Rights history available
Quality key factors
Valuation key factors
Technicals key factors
 Technical Indicator Scale: Bearish, Mildly Bearish, Sideways, Mildly Bullish, Bullish Turned
 Shareholding Snapshot : Mar 2026
Shareholding Compare (%holding)
Promoters
None
Held by 1 Schemes (0.0%)
Held by 0 FIIs
Diwakar Sanku Shetty (25.24%)
Hitesh Ramji Javeri (5.01%)
32.15%
Quarterly Results Snapshot (Standalone) - Mar'26 - YoY

YoY Growth in quarter ended Mar 2026 is 12.49% vs 5.84% in Mar 2025
YoY Growth in quarter ended Mar 2026 is 284.00% vs -77.68% in Mar 2025
Half Yearly Results Snapshot (Standalone) - Sep'25
Growth in half year ended Sep 2025 is 5.49% vs -11.45% in Sep 2024
Growth in half year ended Sep 2025 is 1.52% vs -27.95% in Sep 2024
Nine Monthly Results Snapshot (Standalone) - Dec'25
YoY Growth in nine months ended Dec 2025 is 6.06% vs -7.45% in Dec 2024
YoY Growth in nine months ended Dec 2025 is 7.42% vs -47.69% in Dec 2024
Annual Results Snapshot (Standalone) - Mar'26
YoY Growth in year ended Mar 2026 is 7.59% vs -4.60% in Mar 2025
YoY Growth in year ended Mar 2026 is 29.87% vs -52.83% in Mar 2025
About Shetron Ltd

Company Coordinates


