
Compare Edelweiss.Fin. with Similar Stocks
Stock DNA
Holding Company
INR 11,941 Cr (Small Cap)
20.00
21
1.20%
4.02
12.55%
2.57
Total Returns (Price + Dividend) 
Latest dividend: 1.5 per share ex-dividend date: Sep-11-2025
Risk Adjusted Returns v/s
Returns Beta

News
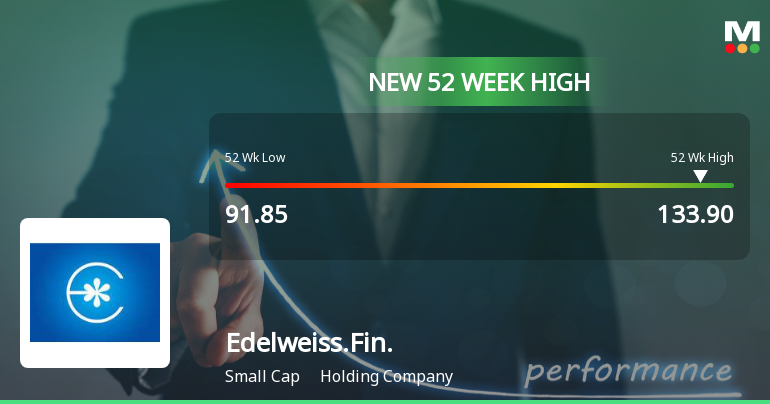
Broad-Based Technical Strength Lifts Edelweiss Financial Services Ltd to 52-Week High of Rs 133.9
Surging past its previous peaks, Edelweiss Financial Services Ltd reached a new 52-week high of Rs 133.9 on 23 Jun 2026, marking a significant milestone in its recent price momentum. This breakout comes after an impressive eight-day winning streak that has propelled the stock up by 24.28%, outpacing its sector and the broader market.
Read full news article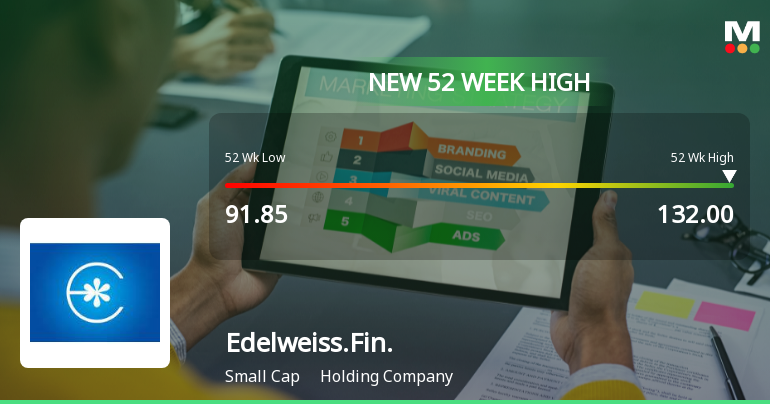
Broad-Based Technical Strength Lifts Edelweiss Financial Services Ltd to 52-Week High of Rs 130.6
With a sustained seven-day rally delivering a 24.09% gain, Edelweiss Financial Services Ltd has surged to touch an intraday high of Rs 130.6 on 22 Jun 2026, just 0.04% shy of its 52-week peak of Rs 130.65. This milestone caps a year-long ascent from Rs 91.85, representing a 29.59% return that notably outpaces the Sensex’s decline of 6.33% over the same period.
Read full news article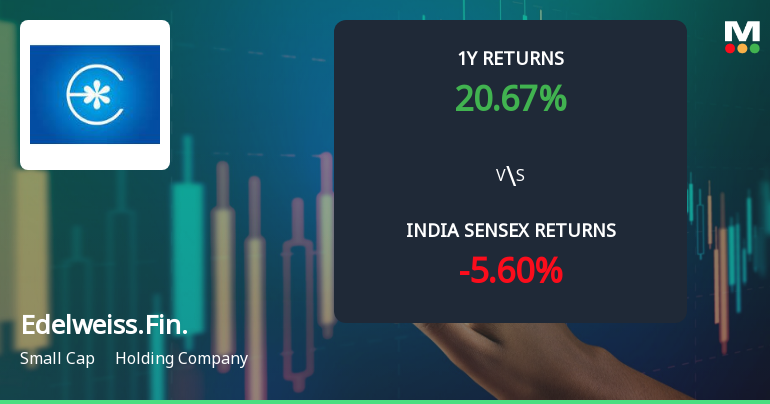
Edelweiss Financial Services Ltd Sees Bullish Momentum Amid Technical Upgrades
Edelweiss Financial Services Ltd has demonstrated a notable shift in technical momentum, moving from a mildly bullish stance to a more confident bullish trend. This change is underpinned by a combination of positive price action, improving moving averages, and mixed but generally encouraging signals from key technical indicators such as MACD, RSI, and Bollinger Bands. The stock’s recent performance has outpaced the broader Sensex, signalling renewed investor interest in this small-cap holding company.
Read full news article Announcements
Shareholder Meeting / Postal Ballot-Scrutinizers Report
15-Jun-2026 | Source : BSEDisclosure of Voting Results pursuant to the Securities and Exchange Board of India (Listing Obligations and Disclosure Requirements) Regulations 2015
Intimation Under The Securities And Exchange Board Of India (Listing Obligations And Disclosure Requirements) Regulations 2015
11-Jun-2026 | Source : BSEIntimation under the Securities and Exchange Board of India (Listing Obligations and Disclosure Requirements) Regulations 2015 in relation to Early Closure of Public Issue of Non-convertible Debenture
Press Release
08-Jun-2026 | Source : BSEEnclosed is the press release titled Edelweiss Financial Services Limited announces ?3000 million Public Issue of Secured Redeemable Non-Convertible Debentures (NCDs).
Corporate Actions

No Upcoming Board Meetings

Edelweiss Financial Services Ltd has declared 150% dividend, ex-date: 11 Sep 25

Edelweiss Financial Services Ltd has announced 1:5 stock split, ex-date: 10 Aug 10

Edelweiss Financial Services Ltd has announced 1:1 bonus issue, ex-date: 10 Aug 10

No Rights history available
Quality key factors
Valuation key factors
Technicals key factors
 Technical Indicator Scale: Bearish, Mildly Bearish, Sideways, Mildly Bullish, Bullish Turned
 Shareholding Snapshot : Mar 2026
Shareholding Compare (%holding)
Non Institution
8.8979
Held by 9 Schemes (1.01%)
Held by 146 FIIs (19.04%)
Rashesh Chandrakant Shah (15.38%)
Life Insurance Corporation Of India (2.57%)
29.71%
Quarterly Results Snapshot (Consolidated) - Mar'26 - YoY

YoY Growth in quarter ended Mar 2026 is -15.88% vs -22.09% in Mar 2025
YoY Growth in quarter ended Mar 2026 is -16.84% vs -37.71% in Mar 2025
Half Yearly Results Snapshot (Consolidated) - Sep'25

Growth in half year ended Sep 2025 is -19.30% vs 23.08% in Sep 2024
Growth in half year ended Sep 2025 is 15.41% vs 33.70% in Sep 2024
Nine Monthly Results Snapshot (Consolidated) - Dec'25
YoY Growth in nine months ended Dec 2025 is 21.76% vs 6.95% in Dec 2024
YoY Growth in nine months ended Dec 2025 is 56.40% vs 16.66% in Dec 2024
Annual Results Snapshot (Consolidated) - Mar'26
YoY Growth in year ended Mar 2026 is 12.61% vs -0.68% in Mar 2025
YoY Growth in year ended Mar 2026 is 37.06% vs -5.20% in Mar 2025
About Edelweiss Financial Services Ltd

Company Coordinates


