
Compare United Breweries with Similar Stocks
Dashboard
The company has declared Negative results for the last 3 consecutive quarters
- PBT LESS OI(Q) At Rs 34.12 cr has Fallen at -75.3% (vs previous 4Q average)
- PAT(Q) At Rs 36.93 cr has Fallen at -64.9% (vs previous 4Q average)
- OPERATING PROFIT TO NET SALES (Q) Lowest at 6.19%
Below par performance in long term as well as near term
Total Returns (Price + Dividend) 
Latest dividend: 10 per share ex-dividend date: Jul-31-2025
Risk Adjusted Returns v/s
Returns Beta

News
United Breweries Ltd. is Rated Sell by MarketsMOJO
United Breweries Ltd. is rated 'Sell' by MarketsMOJO, with this rating last updated on 17 Nov 2025. However, the analysis and financial metrics discussed here reflect the stock's current position as of 19 June 2026, providing investors with an up-to-date perspective on the company’s performance and outlook.
Read full news article
United Breweries Ltd. is Rated Sell
United Breweries Ltd. is rated 'Sell' by MarketsMOJO, with this rating last updated on 17 Nov 2025. However, the analysis and financial metrics discussed here reflect the stock's current position as of 08 June 2026, providing investors with an up-to-date perspective on the company’s performance and outlook.
Read full news article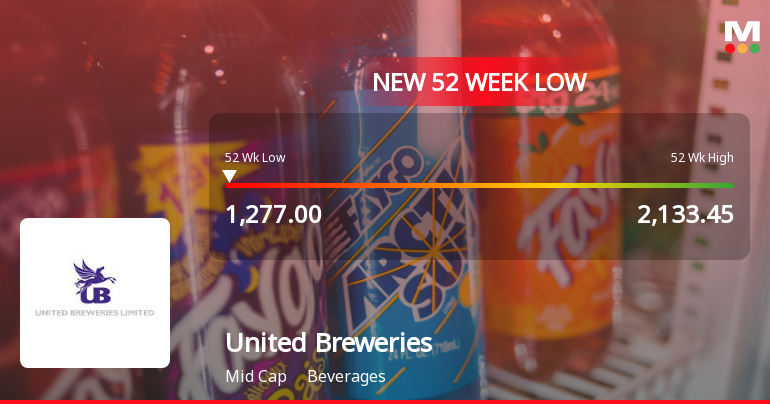
United Breweries Ltd. Falls to 52-Week Low of Rs 1277 as Sell-Off Deepens
For the fourth consecutive session, United Breweries Ltd. has closed lower, culminating in a fresh 52-week low of Rs 1277 on 2 Jun 2026. This marks a 36.05% decline over the past year, significantly underperforming the Sensex's 9.11% fall during the same period.
Read full news article Announcements
General Update
08-Jun-2026 | Source : BSEIntimation of Loss of Share Certificate
General Updates
01-Jun-2026 | Source : BSEIntimation of Loss of Share Certificate
General Updates
25-May-2026 | Source : BSEIntimation of Loss of Share Certificate
Corporate Actions

No Upcoming Board Meetings

United Breweries Ltd. has declared 1000% dividend, ex-date: 31 Jul 25

United Breweries Ltd. has announced 1:10 stock split, ex-date: 09 Jun 06

No Bonus history available

United Breweries Ltd. has announced 1:9 rights issue, ex-date: 10 Apr 08
Quality key factors
Valuation key factors
Technicals key factors
 Technical Indicator Scale: Bearish, Mildly Bearish, Sideways, Mildly Bullish, Bullish Turned
 Shareholding Snapshot : Mar 2026
Shareholding Compare (%holding)
Promoters
12.4037
Held by 25 Schemes (16.94%)
Held by 132 FIIs (4.94%)
Scottish And Newcastle India Limited (34.04%)
Sbi Equity Hybrid Fund (4.65%)
2.5%
Quarterly Results Snapshot (Consolidated) - Mar'26 - QoQ

QoQ Growth in quarter ended Mar 2026 is 8.56% vs 0.97% in Dec 2025

QoQ Growth in quarter ended Mar 2026 is 25.65% vs 74.12% in Dec 2025
Half Yearly Results Snapshot (Consolidated) - Sep'25
Growth in half year ended Sep 2025 is 7.08% vs 10.25% in Sep 2024
Growth in half year ended Sep 2025 is -24.64% vs 25.56% in Sep 2024
Nine Monthly Results Snapshot (Consolidated) - Dec'25
YoY Growth in nine months ended Dec 2025 is 6.03% vs 10.06% in Dec 2024
YoY Growth in nine months ended Dec 2025 is -9.51% vs 4.65% in Dec 2024
Annual Results Snapshot (Consolidated) - Mar'26
YoY Growth in year ended Mar 2026 is 3.64% vs 9.76% in Mar 2025
YoY Growth in year ended Mar 2026 is -6.46% vs 7.72% in Mar 2025
About United Breweries Ltd.

Company Coordinates


