
Compare Rishi Laser with Similar Stocks
Stock DNA
Industrial Manufacturing
INR 129 Cr (Micro Cap)
28.00
39
0.00%
0.41
5.66%
1.73
Total Returns (Price + Dividend) 
Latest dividend: 1.3 per share ex-dividend date: Sep-19-2011
Risk Adjusted Returns v/s
Returns Beta

News
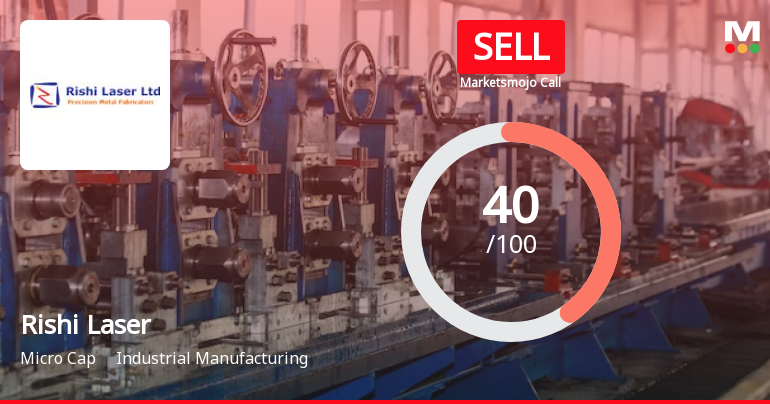
Rishi Laser Ltd is Rated Sell
Rishi Laser Ltd is rated 'Sell' by MarketsMOJO, with this rating last updated on 09 April 2026. However, the analysis and financial metrics discussed here reflect the stock's current position as of 08 July 2026, providing investors with an up-to-date view of the company’s fundamentals, returns, and technical outlook.
Read full news article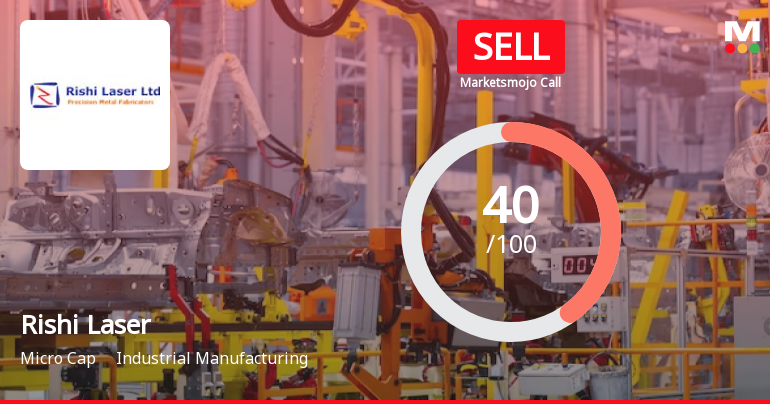
Rishi Laser Ltd is Rated Sell
Rishi Laser Ltd is rated 'Sell' by MarketsMOJO, with this rating last updated on 09 Apr 2026. However, the analysis and financial metrics discussed below reflect the stock's current position as of 27 June 2026, providing investors with an up-to-date view of the company’s fundamentals, valuation, financial trends, and technical outlook.
Read full news article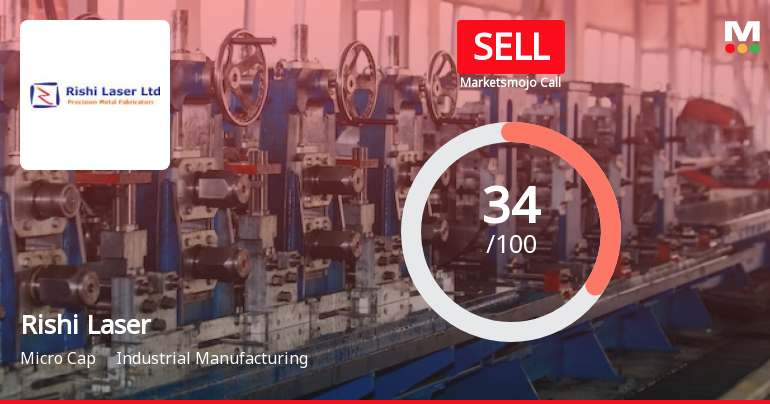
Rishi Laser Ltd is Rated Sell by MarketsMOJO
Rishi Laser Ltd is rated Sell by MarketsMOJO, with this rating last updated on 09 April 2026. However, the analysis and financial metrics discussed here reflect the stock's current position as of 16 June 2026, providing investors with an up-to-date view of the company’s performance and outlook.
Read full news article Announcements
Closure of Trading Window
22-Jun-2026 | Source : BSEenclosed the intimation for closure of trading window
Announcement under Regulation 30 (LODR)-Earnings Call Transcript
09-Jun-2026 | Source : BSEenclosed earning call transcript for Q4 FY 2026 meeting dated 05.06.2026
Disclosures under Reg. 29(2) of SEBI (SAST) Regulations 2011
06-Jun-2026 | Source : BSEThe Exchange has received the disclosure under Regulation 29(2) of SEBI (Substantial Acquisition of Shares & Takeovers) Regulations 2011 for Harshad Bhavanbhai Patel
Corporate Actions

No Upcoming Board Meetings

Rishi Laser Ltd has declared 13% dividend, ex-date: 19 Sep 11

No Splits history available

No Bonus history available

No Rights history available
Quality key factors
Valuation key factors
Technicals key factors
 Technical Indicator Scale: Bearish, Mildly Bearish, Sideways, Mildly Bullish, Bullish Turned
 Shareholding Snapshot : May 2026
Shareholding Compare (%holding)
Non Institution
None
Held by 0 Schemes
Held by 0 FIIs
Harshad Bhavanbhai Patel (14.23%)
Archway Holdings Ltd (6.15%)
64.53%
Quarterly Results Snapshot (Standalone) - Mar'26 - QoQ

QoQ Growth in quarter ended Mar 2026 is 12.01% vs -15.06% in Dec 2025

QoQ Growth in quarter ended Mar 2026 is -620.00% vs -97.63% in Dec 2025
Half Yearly Results Snapshot (Standalone) - Sep'25
Growth in half year ended Sep 2025 is 10.37% vs 2.54% in Sep 2024
Growth in half year ended Sep 2025 is 5.15% vs -9.56% in Sep 2024
Nine Monthly Results Snapshot (Standalone) - Dec'25
YoY Growth in nine months ended Dec 2025 is 6.47% vs 7.03% in Dec 2024
YoY Growth in nine months ended Dec 2025 is -22.18% vs -3.44% in Dec 2024
Annual Results Snapshot (Standalone) - Mar'26
YoY Growth in year ended Mar 2026 is 6.84% vs 7.57% in Mar 2025
YoY Growth in year ended Mar 2026 is -55.52% vs -5.50% in Mar 2025
About Rishi Laser Ltd

Company Coordinates


