
Compare Rishi Laser with Similar Stocks
Dashboard
Strong ability to service debt as the company has a low Debt to EBITDA ratio of 2.79 times
Healthy long term growth as Operating profit has grown by an annual rate 43.21%
Negative results in Mar 26
With ROCE of 7.9, it has a Attractive valuation with a 1.5 Enterprise value to Capital Employed
Underperformed the market in the last 1 year
Stock DNA
Industrial Manufacturing
INR 128 Cr (Micro Cap)
27.00
39
0.00%
0.41
5.66%
1.71
Total Returns (Price + Dividend) 
Latest dividend: 1.3 per share ex-dividend date: Sep-19-2011
Risk Adjusted Returns v/s
Returns Beta

News
Rishi Laser Ltd Upgraded to Hold as Technicals Improve Amid Mixed Financials
Rishi Laser Ltd, a micro-cap player in the industrial manufacturing sector, has seen its investment rating upgraded from Sell to Hold as of 10 July 2026. This change reflects a nuanced reassessment of the company’s quality, valuation, financial trends, and technical indicators amid mixed recent performance and promising long-term prospects.
Read full news article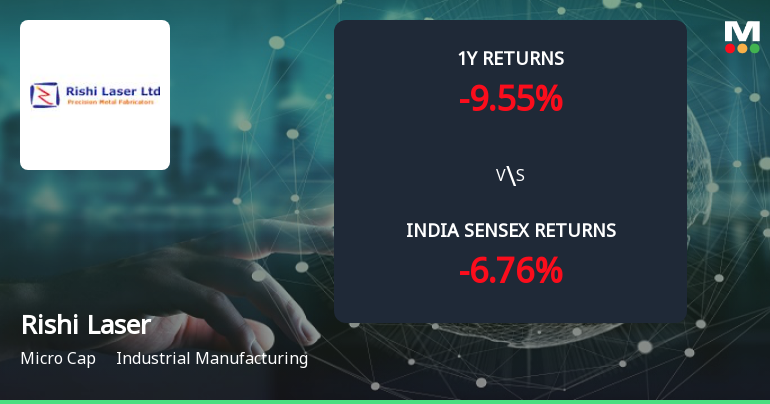
Golden Cross Forms in Rishi Laser Ltd — Mixed Technical Signals and Micro-Cap Context
The 50-day moving average has crossed above the 200-day moving average for Rishi Laser Ltd, signalling a golden cross on 10 Jul 2026. Yet, the broader technical picture is conflicted, with monthly indicators showing mild bearishness and the stock’s micro-cap status raising questions about the signal’s reliability.
Read full news article
Rishi Laser Ltd is Rated Sell
Rishi Laser Ltd is rated 'Sell' by MarketsMOJO, with this rating last updated on 09 April 2026. However, the analysis and financial metrics discussed here reflect the stock's current position as of 08 July 2026, providing investors with an up-to-date view of the company’s fundamentals, returns, and technical outlook.
Read full news article Announcements
Compliances-Certificate under Reg. 74 (5) of SEBI (DP) Regulations 2018
14-Jul-2026 | Source : BSEenclosed the certificate under Reg 74(5)
Closure of Trading Window
22-Jun-2026 | Source : BSEenclosed the intimation for closure of trading window
Announcement under Regulation 30 (LODR)-Earnings Call Transcript
09-Jun-2026 | Source : BSEenclosed earning call transcript for Q4 FY 2026 meeting dated 05.06.2026
Corporate Actions

No Upcoming Board Meetings

Rishi Laser Ltd has declared 13% dividend, ex-date: 19 Sep 11

No Splits history available

No Bonus history available

No Rights history available
Quality key factors
Valuation key factors
Technicals key factors
 Technical Indicator Scale: Bearish, Mildly Bearish, Sideways, Mildly Bullish, Bullish Turned
 Shareholding Snapshot : May 2026
Shareholding Compare (%holding)
Non Institution
None
Held by 0 Schemes
Held by 0 FIIs
Harshad Bhavanbhai Patel (14.23%)
Archway Holdings Ltd (6.15%)
64.53%
Quarterly Results Snapshot (Standalone) - Mar'26 - QoQ

QoQ Growth in quarter ended Mar 2026 is 12.01% vs -15.06% in Dec 2025

QoQ Growth in quarter ended Mar 2026 is -620.00% vs -97.63% in Dec 2025
Half Yearly Results Snapshot (Standalone) - Sep'25
Growth in half year ended Sep 2025 is 10.37% vs 2.54% in Sep 2024
Growth in half year ended Sep 2025 is 5.15% vs -9.56% in Sep 2024
Nine Monthly Results Snapshot (Standalone) - Dec'25
YoY Growth in nine months ended Dec 2025 is 6.47% vs 7.03% in Dec 2024
YoY Growth in nine months ended Dec 2025 is -22.18% vs -3.44% in Dec 2024
Annual Results Snapshot (Standalone) - Mar'26
YoY Growth in year ended Mar 2026 is 6.84% vs 7.57% in Mar 2025
YoY Growth in year ended Mar 2026 is -55.52% vs -5.50% in Mar 2025
About Rishi Laser Ltd

Company Coordinates


