
Compare ATV Projects with Similar Stocks
Stock DNA
Industrial Manufacturing
INR 141 Cr (Micro Cap)
20.00
36
0.00%
0.14
3.35%
0.66
Total Returns (Price + Dividend) 
ATV Projects for the last several years.
Risk Adjusted Returns v/s
Returns Beta

News
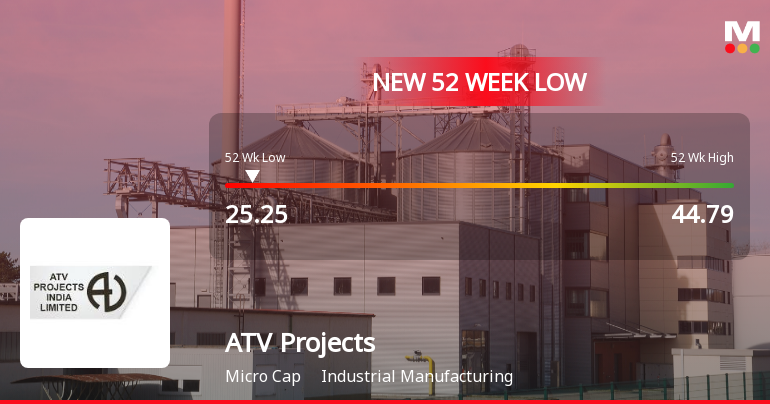
Markets Rally, But ATV Projects India Ltd Sinks to 52-Week Low in Stock-Specific Sell-Off
While broader indices have shown resilience, ATV Projects India Ltd has succumbed to persistent selling pressure, hitting a fresh 52-week low of Rs 25.25 on 8 Jul 2026. This decline marks a significant divergence from the market's overall trend and raises questions about the underlying factors weighing on the stock.
Read full news article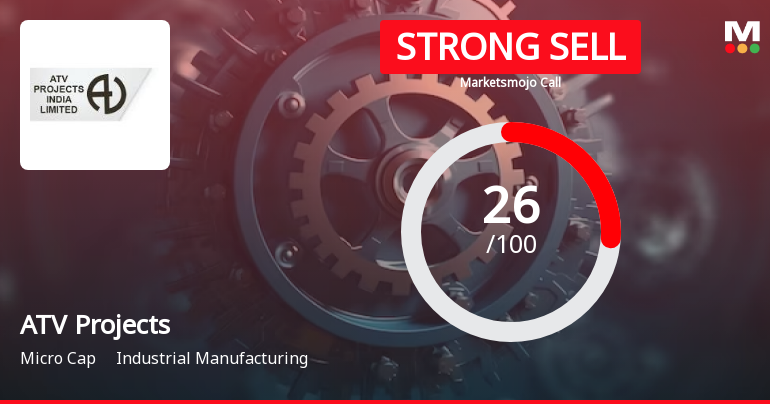
ATV Projects India Ltd is Rated Strong Sell
ATV Projects India Ltd is rated Strong Sell by MarketsMOJO. This rating was last updated on 23 February 2026, reflecting a reassessment of the stock’s outlook. However, all fundamentals, returns, and financial metrics discussed here are current as of 07 July 2026, providing investors with the latest perspective on the company’s position.
Read full news article
Announcements
Intimation Regarding Report Received From Registrar And Share Transfer Agent On Re-Lodgement Of Transfer Requests For Physical Shares
02-Jul-2026 | Source : BSEPlease find the attached intimation
Closure of Trading Window
25-Jun-2026 | Source : BSEPlease find the attached intimation for Trading Window Closure for the quarter 30.06.2026
Compliances-Reg.24(A)-Annual Secretarial Compliance
22-May-2026 | Source : BSEPlease find the attached annual secretarial compliance report for the year ended 31.03.2026.
Corporate Actions

No Upcoming Board Meetings

No Dividend history available

No Splits history available

No Bonus history available

No Rights history available
Quality key factors
Valuation key factors
Technicals key factors
 Technical Indicator Scale: Bearish, Mildly Bearish, Sideways, Mildly Bullish, Bullish Turned
 Shareholding Snapshot : Mar 2026
Shareholding Compare (%holding)
Non Institution
None
Held by 42 Schemes (0.43%)
Held by 0 FIIs
Mahesh Chaturvedi And Sons (huf) (19.87%)
Seftech India Private Limited (7.56%)
56.89%
Quarterly Results Snapshot (Standalone) - Mar'26 - YoY

YoY Growth in quarter ended Mar 2026 is 13.05% vs -7.40% in Mar 2025

YoY Growth in quarter ended Mar 2026 is -19.84% vs 69.08% in Mar 2025
Half Yearly Results Snapshot (Standalone) - Sep'25
Growth in half year ended Sep 2025 is -21.31% vs 21.31% in Sep 2024
Growth in half year ended Sep 2025 is 10.44% vs -15.05% in Sep 2024
Nine Monthly Results Snapshot (Standalone) - Dec'25
YoY Growth in nine months ended Dec 2025 is -9.91% vs 24.71% in Dec 2024
YoY Growth in nine months ended Dec 2025 is 5.59% vs -2.23% in Dec 2024
Annual Results Snapshot (Standalone) - Mar'26
YoY Growth in year ended Mar 2026 is -4.14% vs 14.69% in Mar 2025
YoY Growth in year ended Mar 2026 is -3.24% vs 14.55% in Mar 2025
About ATV Projects India Ltd

Company Coordinates


