
Compare SPIC with Similar Stocks
Dashboard
Flat results in Mar 26
- PBT LESS OI(Q) At Rs 34.40 cr has Fallen at -45.5% (vs previous 4Q average)
- PAT(Q) At Rs 29.49 cr has Fallen at -41.5% (vs previous 4Q average)
- NET SALES(Q) Lowest at Rs 584.15 cr
Despite the size of the company, domestic mutual funds hold only 0.01% of the company
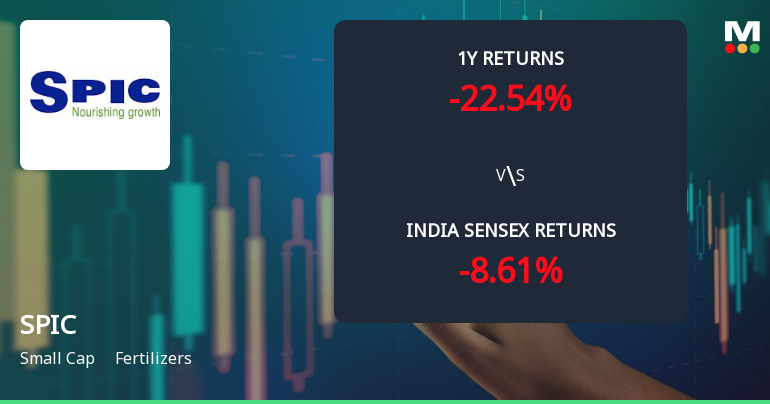
Consistent Underperformance against the benchmark over the last 3 years
Total Returns (Price + Dividend) 
Latest dividend: 2 per share ex-dividend date: Sep-16-2025
Risk Adjusted Returns v/s
Returns Beta

News
Southern Petrochemical Industries Corp Ltd Faces Bearish Momentum Amid Technical Downgrade
Southern Petrochemical Industries Corporation Ltd. (SPIC), a small-cap player in the fertiliser sector, has experienced a notable shift in its technical momentum, with key indicators signalling a bearish trend. The stock’s recent downgrade from Hold to Sell by MarketsMOJO, accompanied by a Mojo Score of 40.0, reflects growing concerns over its price performance and technical health amid broader market pressures.
Read full news article
Southern Petrochemical Industries Corporation Ltd. is Rated Sell
Southern Petrochemical Industries Corporation Ltd. is rated 'Sell' by MarketsMOJO, with this rating last updated on 22 May 2026. However, the analysis and financial metrics discussed here reflect the stock's current position as of 02 July 2026, providing investors with an up-to-date view of the company’s fundamentals, returns, and market performance.
Read full news article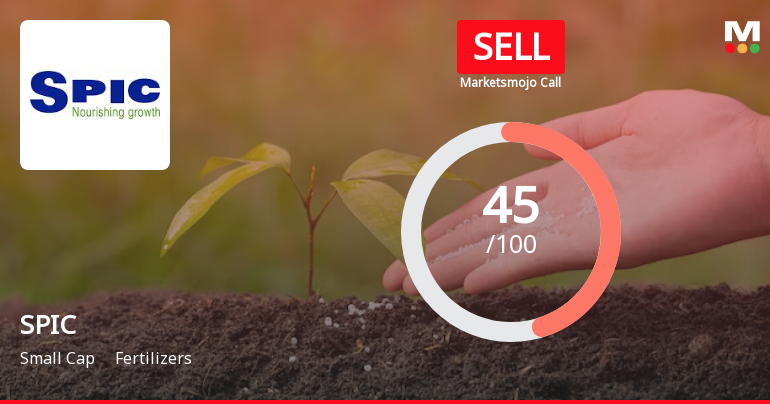
Southern Petrochemical Industries Corporation Ltd. is Rated Sell
Southern Petrochemical Industries Corporation Ltd. is rated 'Sell' by MarketsMOJO, with this rating last updated on 22 May 2026. However, the analysis and financial metrics discussed here reflect the stock's current position as of 21 June 2026, providing investors with an up-to-date view of the company’s fundamentals, returns, and market performance.
Read full news article Announcements
Outcome of Board Meeting
25-May-2026 | Source : BSESouthern Petrochemicals Industries Corporation Ltd has informed BSE regarding Outcome of Board Meeting held on May 22 2026.
Standalone & Consolidated Financial Results Auditors Report for March 31 2026
25-May-2026 | Source : BSESouthern Petrochemicals Industries Corporation Ltd has informed BSE about :
1. Standalone Financial Results for the period ended March 31 2026
2. Consolidated Financial Results for the period ended March 31 2026
3. Standalone Auditors Report for the period ended March 31 2026
4. Consolidated Auditors Report for the period ended March 31 2026
5. Standalone Cash Flow Statement for the period ended March 31 2026
6. Consolidated Cash Flow Statement for the period ended March 31 2026
Board recommends Dividend
25-May-2026 | Source : BSESouthern Petrochemicals Industries Corporation Ltd has informed BSE that the Board of Directors of the Company at its meeting held on May 22 2026 inter alia have recommended a Dividend of 20% on the Equity Shares of face value of Rs. 10/- each i.e. Rs. 2/- per Equity Share for the Financial Year 2025-26 subject to the approval of the Shareholders at the ensuing 55th Annual General Meeting (AGM).
Corporate Actions

No Upcoming Board Meetings

Southern Petrochemical Industries Corporation Ltd. has declared 20% dividend, ex-date: 16 Sep 25

No Splits history available

No Bonus history available

No Rights history available
Quality key factors
Valuation key factors
Technicals key factors
 Technical Indicator Scale: Bearish, Mildly Bearish, Sideways, Mildly Bullish, Bullish Turned
 Shareholding Snapshot : Mar 2026
Shareholding Compare (%holding)
Promoters
None
Held by 12 Schemes (0.01%)
Held by 27 FIIs (5.08%)
Ami Holdings Private Limited (19.95%)
Ares Diversified (4.18%)
33.23%
Quarterly Results Snapshot (Consolidated) - Mar'26 - QoQ

QoQ Growth in quarter ended Mar 2026 is -24.52% vs -5.31% in Dec 2025
QoQ Growth in quarter ended Mar 2026 is -45.46% vs -11.68% in Dec 2025
Half Yearly Results Snapshot (Consolidated) - Sep'25
Growth in half year ended Sep 2025 is 5.55% vs 15.34% in Sep 2024

Growth in half year ended Sep 2025 is 30.91% vs -6.06% in Sep 2024
Nine Monthly Results Snapshot (Consolidated) - Dec'25
YoY Growth in nine months ended Dec 2025 is 1.71% vs 28.20% in Dec 2024
YoY Growth in nine months ended Dec 2025 is 33.61% vs -0.79% in Dec 2024
Annual Results Snapshot (Consolidated) - Mar'26
YoY Growth in year ended Mar 2026 is -4.22% vs 58.77% in Mar 2025
YoY Growth in year ended Mar 2026 is 35.90% vs 37.64% in Mar 2025
About Southern Petrochemical Industries Corporation Ltd.

Company Coordinates


