
Compare Onward Technolog with Similar Stocks
Dashboard
Company has a Debt to Equity ratio (avg) of 0.01 times
Healthy long term growth as Operating profit has grown by an annual rate 52.44%
The company has declared Positive results for the last 5 consecutive quarters
With ROE of 18.4, it has a Very Attractive valuation with a 2.5 Price to Book Value
Falling Participation by Institutional Investors
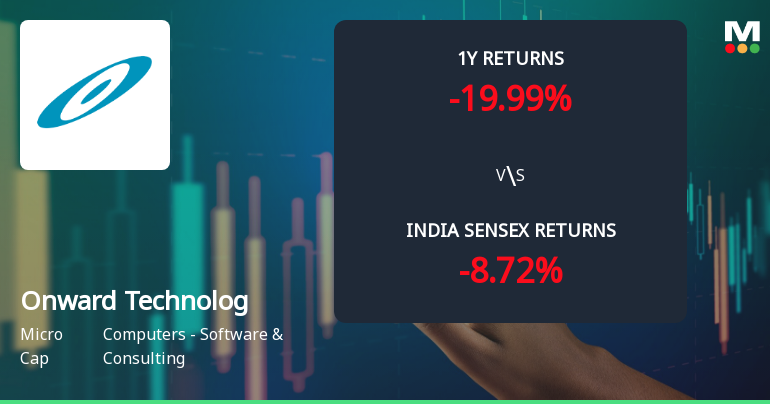
Consistent Underperformance against the benchmark over the last 3 years
Stock DNA
Computers - Software & Consulting
INR 634 Cr (Micro Cap)
14.00
20
1.79%
-0.28
18.44%
2.50
Total Returns (Price + Dividend) 
Latest dividend: 5 per share ex-dividend date: Jul-04-2025
Risk Adjusted Returns v/s
Returns Beta

News
Onward Technologies Ltd Technical Momentum Shifts Amid Mixed Market Signals
Onward Technologies Ltd, a micro-cap player in the Computers - Software & Consulting sector, has experienced a notable shift in its technical momentum, moving from a mildly bearish stance to a sideways trend. Despite a modest day gain of 1.25%, the stock’s technical indicators present a complex picture, with mixed signals from MACD, RSI, moving averages, and other momentum oscillators, suggesting cautious investor sentiment as the company navigates a challenging market environment.
Read full news article
Onward Technologies Ltd is Rated Hold
Onward Technologies Ltd is rated 'Hold' by MarketsMOJO, with this rating last updated on 23 February 2026. However, the analysis and financial metrics discussed below reflect the stock's current position as of 20 June 2026, providing investors with an up-to-date view of the company’s fundamentals, valuation, financial trends, and technical outlook.
Read full news article
Onward Technologies Ltd is Rated Hold
Onward Technologies Ltd is rated 'Hold' by MarketsMOJO, with this rating last updated on 23 February 2026. However, the analysis and financial metrics discussed below reflect the stock's current position as of 09 June 2026, providing investors with an up-to-date view of the company’s fundamentals, valuation, financial trends, and technical outlook.
Read full news article Announcements
Closure of Trading Window
26-Jun-2026 | Source : BSEClosure of trading window
Announcement under Regulation 30 (LODR)-Award_of_Order_Receipt_of_Order
25-Jun-2026 | Source : BSEIntimation of receipt of engineering services contract under Regulation 30 of SEBI(LODR) Regulations 2015
Announcement under Regulation 30 (LODR)-Newspaper Publication
23-Jun-2026 | Source : BSENewspaper Publication
Corporate Actions

No Upcoming Board Meetings

Onward Technologies Ltd has declared 80% dividend, ex-date: 03 Jul 26

No Splits history available

No Bonus history available

No Rights history available
Quality key factors
Valuation key factors
Technicals key factors
 Technical Indicator Scale: Bearish, Mildly Bearish, Sideways, Mildly Bullish, Bullish Turned
 Shareholding Snapshot : Jun 2026
Shareholding Compare (%holding)
Non Institution
None
Held by 3 Schemes (1.45%)
Held by 8 FIIs (9.33%)
Jhm Enterprises Private Limited (35.34%)
Infinity Direct Holdings (8.56%)
31.85%
Quarterly Results Snapshot (Consolidated) - Mar'26 - YoY

YoY Growth in quarter ended Mar 2026 is 7.72% vs 7.47% in Mar 2025

YoY Growth in quarter ended Mar 2026 is -8.26% vs 55.84% in Mar 2025
Half Yearly Results Snapshot (Consolidated) - Sep'25
Growth in half year ended Sep 2025 is 13.08% vs 0.33% in Sep 2024
Growth in half year ended Sep 2025 is 132.08% vs -48.02% in Sep 2024
Nine Monthly Results Snapshot (Consolidated) - Dec'25
YoY Growth in nine months ended Dec 2025 is 11.73% vs 2.85% in Dec 2024
YoY Growth in nine months ended Dec 2025 is 108.58% vs -38.80% in Dec 2024
Annual Results Snapshot (Consolidated) - Mar'26
YoY Growth in year ended Mar 2026 is 10.69% vs 4.01% in Mar 2025
YoY Growth in year ended Mar 2026 is 63.66% vs -20.17% in Mar 2025
About Onward Technologies Ltd

Company Coordinates


