
Compare Ksolves India with Similar Stocks
Stock DNA
Computers - Software & Consulting
INR 688 Cr (Micro Cap)
20.00
20
3.79%
-0.05
116.85%
23.43
Total Returns (Price + Dividend) 
Latest dividend: 4.9496336996337 per share ex-dividend date: Jan-27-2026
Risk Adjusted Returns v/s
Returns Beta

News
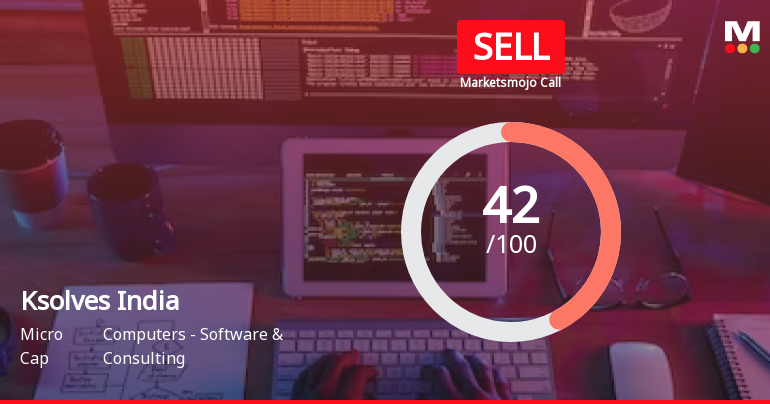
Ksolves India Ltd is Rated Sell by MarketsMOJO
Ksolves India Ltd is rated 'Sell' by MarketsMOJO, with this rating last updated on 21 July 2025. However, the analysis and financial metrics discussed here reflect the stock's current position as of 20 June 2026, providing investors with an up-to-date view of the company’s fundamentals, returns, and market performance.
Read full news article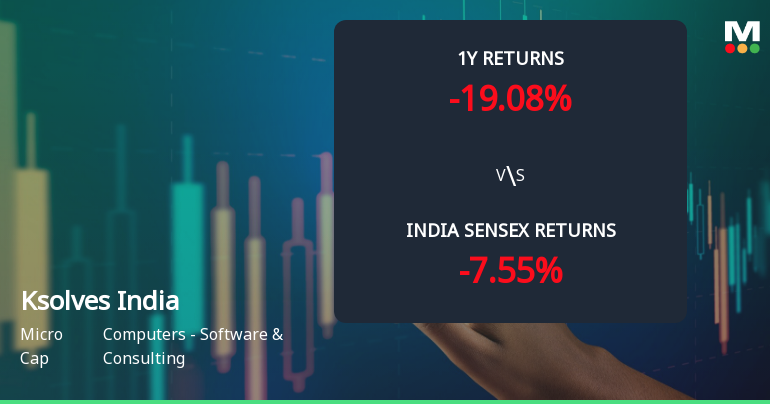
Ksolves India Ltd Technical Momentum Shifts Amid Mixed Market Signals
Ksolves India Ltd, a micro-cap player in the Computers - Software & Consulting sector, has exhibited a subtle shift in its technical momentum, moving from a bearish to a mildly bearish trend. Despite a modest day gain of 2.57%, the stock’s technical indicators present a complex picture, with mixed signals across weekly and monthly timeframes, challenging investors to carefully analyse the evolving price dynamics.
Read full news article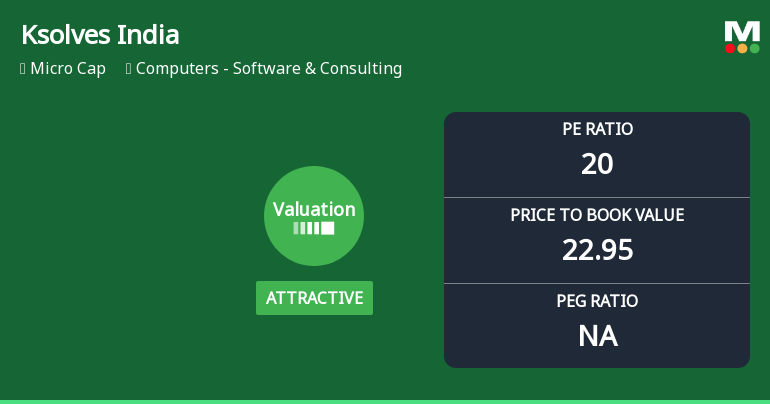
Ksolves India Ltd Valuation Improves Amid Mixed Market Returns
Ksolves India Ltd, a micro-cap player in the Computers - Software & Consulting sector, has witnessed a notable improvement in its valuation attractiveness, shifting from very attractive to attractive. Despite this positive change in price metrics, the company’s stock performance over recent periods remains mixed, with returns lagging behind the broader Sensex benchmark. This article analyses the valuation parameters, peer comparisons, and market context to provide a comprehensive view of Ksolves India’s current investment appeal.
Read full news article Announcements
Announcement under Regulation 30 (LODR)-Analyst / Investor Meet - Outcome
06-May-2026 | Source : BSEDear Sir/Madam Please find attached herewith the earnings call transcripts of the investor conference call held on April 30 2026. Thanks and Regards Manisha Kide Company Secretary and Compliance Officer
Announcement under Regulation 30 (LODR)-Newspaper Publication
06-May-2026 | Source : BSEDear Sir/Madam Please find attached herewith the newspaper publication of financial results. Thanks and Regards Manisha Kide Company Secretary and Compliance Officer
Board Meeting Outcome for Approved Financial Results For Quarter And Financial Year Ended March 31 2026
30-Apr-2026 | Source : BSEDear Sir/Madam Please find attached herewith the outcome of board meeting dated April 30 2026. Thanks and Regards Manisha Kide Company Secretary and Compliance Officer
Corporate Actions

No Upcoming Board Meetings

Ksolves India Ltd has declared 100% dividend, ex-date: 27 Jan 26

Ksolves India Ltd has announced 5:10 stock split, ex-date: 06 Feb 25

Ksolves India Ltd has announced 1:1 bonus issue, ex-date: 06 Sep 21

No Rights history available
Quality key factors
Valuation key factors
Technicals key factors
 Technical Indicator Scale: Bearish, Mildly Bearish, Sideways, Mildly Bullish, Bullish Turned
 Shareholding Snapshot : Mar 2026
Shareholding Compare (%holding)
Promoters
None
Held by 0 Schemes
Held by 4 FIIs (0.08%)
Ratan Kumar Srivastva (31.8%)
Sachin Balkrishna Ramdasi (5.28%)
37.78%
Quarterly Results Snapshot (Consolidated) - Mar'26 - QoQ

QoQ Growth in quarter ended Mar 2026 is 1.73% vs 6.63% in Dec 2025
QoQ Growth in quarter ended Mar 2026 is -1.12% vs 16.53% in Dec 2025
Half Yearly Results Snapshot (Consolidated) - Sep'25
Growth in half year ended Sep 2025 is 16.49% vs 33.39% in Sep 2024
Growth in half year ended Sep 2025 is -18.25% vs 14.66% in Sep 2024
Nine Monthly Results Snapshot (Consolidated) - Dec'25
YoY Growth in nine months ended Dec 2025 is 14.94% vs 33.12% in Dec 2024
YoY Growth in nine months ended Dec 2025 is -13.46% vs 14.94% in Dec 2024
Annual Results Snapshot (Consolidated) - Mar'26
YoY Growth in year ended Mar 2026 is 18.37% vs 26.50% in Mar 2025
YoY Growth in year ended Mar 2026 is 0.03% vs 0.47% in Mar 2025
About Ksolves India Ltd

Company Coordinates


