
Compare Xchanging Sol. with Similar Stocks
Stock DNA
Computers - Software & Consulting
INR 712 Cr (Micro Cap)
12.00
22
3.12%
-0.61
15.01%
1.81
Total Returns (Price + Dividend) 
Latest dividend: 2 per share ex-dividend date: Jul-11-2025
Risk Adjusted Returns v/s
Returns Beta

News

Xchanging Solutions Ltd is Rated Sell
Xchanging Solutions Ltd is rated 'Sell' by MarketsMOJO, with this rating last updated on 06 Nov 2025. However, the analysis and financial metrics discussed here reflect the company’s current position as of 15 June 2026, providing investors with an up-to-date view of the stock’s fundamentals, valuation, financial trends, and technical outlook.
Read full news article
Xchanging Solutions Ltd Technical Momentum Shifts Amid Bearish Market Trends
Xchanging Solutions Ltd, a micro-cap player in the Computers - Software & Consulting sector, has experienced a notable shift in its technical momentum, reflecting a complex interplay of bearish and mildly bullish signals. Despite a recent downgrade from Hold to Sell by MarketsMOJO, the stock’s technical indicators reveal nuanced trends that investors should carefully analyse amid ongoing market volatility.
Read full news article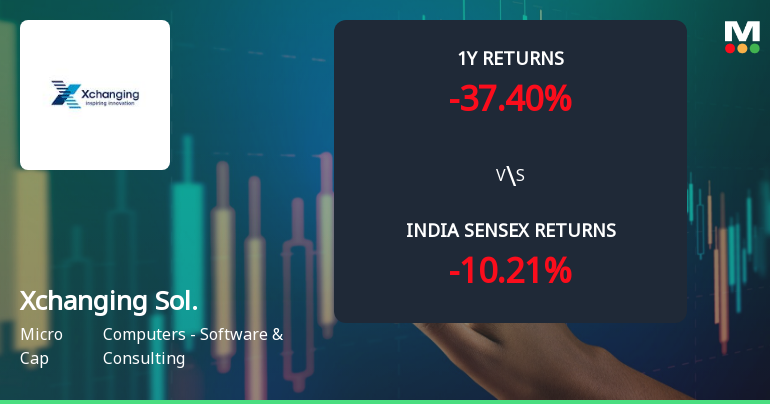
Xchanging Solutions Ltd Faces Bearish Momentum Amid Technical Downgrade
Xchanging Solutions Ltd, a micro-cap player in the Computers - Software & Consulting sector, has experienced a notable shift in technical momentum, with key indicators signalling a bearish trend. The company’s share price has declined sharply over recent periods, reflecting deteriorating market sentiment and technical weakness compared to broader benchmarks such as the Sensex.
Read full news article Announcements
Announcement under Regulation 30 (LODR)-Newspaper Publication
05-Jun-2026 | Source : BSENewspaper Publication
Announcement under Regulation 30 (LODR)-Newspaper Publication
22-May-2026 | Source : BSENewspaper Publication
Financial Results For The Quarter And Year Ended March 31 2026
21-May-2026 | Source : BSEResults
Corporate Actions

No Upcoming Board Meetings

Xchanging Solutions Ltd has declared 20% dividend, ex-date: 11 Jul 25

No Splits history available

No Bonus history available

No Rights history available
Quality key factors
Valuation key factors
Technicals key factors
 Technical Indicator Scale: Bearish, Mildly Bearish, Sideways, Mildly Bullish, Bullish Turned
 Shareholding Snapshot : Mar 2026
Shareholding Compare (%holding)
Promoters
None
Held by 1 Schemes (0.0%)
Held by 7 FIIs (0.11%)
Xchanging (mauritius) Limited (52.07%)
None
22.43%
Quarterly Results Snapshot (Consolidated) - Mar'26 - QoQ

QoQ Growth in quarter ended Mar 2026 is 5.08% vs -7.56% in Dec 2025
QoQ Growth in quarter ended Mar 2026 is 23.22% vs -18.94% in Dec 2025
Half Yearly Results Snapshot (Consolidated) - Sep'25
Growth in half year ended Sep 2025 is 16.13% vs 1.19% in Sep 2024

Growth in half year ended Sep 2025 is 46.85% vs 320.78% in Sep 2024
Nine Monthly Results Snapshot (Consolidated) - Dec'25
YoY Growth in nine months ended Dec 2025 is 13.01% vs 3.23% in Dec 2024
YoY Growth in nine months ended Dec 2025 is 23.70% vs 2,546.21% in Dec 2024
Annual Results Snapshot (Consolidated) - Mar'26
YoY Growth in year ended Mar 2026 is 9.75% vs 6.01% in Mar 2025
YoY Growth in year ended Mar 2026 is 19.91% vs 261.90% in Mar 2025
About Xchanging Solutions Ltd

Company Coordinates


