Avanti Feeds

INR
1,257.75
80.4 (6.83%)
BSENSE

Mar 25

BSE+NSE Vol: 7.38 lacs

  • Price Points
  • Score
  • Mojo Parameters
  • Total Return
  • News and Corporate Actions
  • Key factors
  • Shareholding
  • Financials
  • CompanyCV
stock-summaryPrice Point
High/Low

1Day

52 Week

Valuation
Technical
Day's Volume

CASH

7.38 lacs (42.52%) Volume

Shareholding (Dec 2025)

FII

7.98%

Held by 191 FIIs

DII

3.12%

Held by 6 DIIs

Promoter

43.23%

Who are in the management team of Avanti Feeds?

06-Jun-2025

As of March 2023, the management team of Avanti Feeds includes A Indra Kumar (Chairman & Managing Director), C Ramachandra Rao (Joint Managing Director), and several other directors, both executive and non-executive, responsible for the company's strategic direction.

As of March 2023, the management team of Avanti Feeds includes the following individuals:<BR><BR>1. A Indra Kumar - Chairman & Managing Director<BR>2. C Ramachandra Rao - Joint Managing Director<BR>3. N Ram Prasad - Non-Executive & Non-Independent Director<BR>4. Bunluesak Sorajjakit - Non-Executive & Non-Independent Director<BR>5. N V D S Raju - Non-Executive & Independent Director<BR>6. K Kiranmayee - Non-Executive & Independent Director<BR>7. J V Ramudu - Non-Executive & Independent Director<BR>8. A Venkata Sanjeev - Executive Director<BR>9. V Narasi Reddy - Non-Executive & Independent Director<BR>10. G. Sudarsan Babu - Nominee<BR>11. Peerasak Boonmechote - Director<BR><BR>This team is responsible for the strategic direction and management of the company.

View full answer

What is the bonus history of the Avanti Feeds?

06-Jun-2025

Avanti Feeds issued a 1:2 bonus on June 26, 2018, with a record date of June 27, 2018, meaning shareholders received one additional share for every two shares held.

Avanti Feeds has a bonus history that includes a 1:2 bonus issue announced on June 26, 2018. The record date for this bonus was June 27, 2018. This means that for every two shares held, shareholders received one additional share as a bonus.

View full answer

Has Avanti Feeds declared dividend?

06-Jun-2025

Yes, Avanti Feeds Ltd. has declared a 675% dividend, amounting to ₹6.75 per share, with an ex-date of July 30, 2024. The company has shown strong total returns over various periods, with a total return of 32.33% over the past year.

Avanti Feeds Ltd. has declared a 675% dividend.<BR><BR>Dividend Details:<BR>- Percentage announced: 675%<BR>- Amount per share: 6.75<BR>- Ex-date: 30 Jul 24<BR><BR>Dividend Yield: 0.89%.<BR><BR>Total Returns by Period:<BR>In the last 6 months, Avanti Feeds experienced a price return of 22.27%, with no dividend return, resulting in a total return of 22.27%.<BR><BR>Over the past year, the company achieved a price return of 31.23% and a dividend return of 1.10%, leading to a total return of 32.33%.<BR><BR>In the two-year period, the price return was 90.49%, with a dividend return of 3.35%, culminating in a total return of 93.84%.<BR><BR>For the three-year period, the price return stood at 76.63%, while the dividend return was 4.58%, resulting in a total return of 81.21%.<BR><BR>In the four-year timeframe, the price return was 24.25% and the dividend return was 4.70%, giving a total return of 28.95%.<BR><BR>Lastly, over five years, the price return was 62.61%, with a dividend return of 5.15%, leading to a total return of 67.76%.<BR><BR>Overall, Avanti Feeds has declared a significant dividend and has shown strong total returns across various periods, indicating a positive performance trend for the company.

View full answer

Who are the peers of the Avanti Feeds?

03-Jun-2025

Avanti Feeds' peers include Hind. Unilever, ITC, Nestle India, and Britannia Inds., among others. In terms of returns, Manorama Indust. leads with 129.10% over one year, while Avanti Feeds has a return of 52.16%.

Peers: The peers of Avanti Feeds are Hind. Unilever, ITC, Nestle India, Britannia Inds., Godrej Consumer, Honasa Consumer, Mrs Bectors, Manorama Indust., Dodla Dairy, and Hindustan Foods.<BR><BR>Quality Snapshot: Excellent management risk is observed at ITC, Nestle India, and Britannia Inds., while Good management risk is found at Hind. Unilever, Godrej Consumer, Avanti Feeds, Mrs Bectors, Dodla Dairy, and the rest. Average management risk is noted at Honasa Consumer and Hindustan Foods, while Manorama Indust. has Good management risk but Excellent growth. Below Average growth is seen across Hind. Unilever, ITC, Britannia Inds., Godrej Consumer, Avanti Feeds, Honasa Consumer, and Dodla Dairy, while Average growth is noted at Nestle India, and Excellent growth is observed at Manorama Indust.<BR><BR>Return Snapshot: The peer with the highest 1-year return is Manorama Indust. at 129.10%, while Honasa Consumer has the lowest at -32.21%. Avanti Feeds has a 1-year return of 52.16%, which is significantly higher than Honasa Consumer but lower than Manorama Indust. Additionally, Godrej Consumer, Mrs Bectors, and Hindustan Foods have negative six-month returns.

View full answer

What does Avanti Feeds do?

17-Jul-2025

Avanti Feeds Ltd. is a prominent manufacturer of shrimp feed in the FMCG sector, established in 1993, with a market cap of INR 9,769 Cr and reported net sales of 13,851 Cr and net profit of 1,518 Cr for March 2025. Key metrics include a P/E of 19.00 and a dividend yield of 0.94%.

Overview:<BR>Avanti Feeds Ltd. is a leading manufacturer of high-quality shrimp feed and operates in the FMCG industry within the mid-cap market segment.<BR><BR>History:<BR>Avanti Feeds Ltd. commenced its commercial operations in 1993 and has since established itself as a key player in aquaculture. The latest reported quarter for net sales and profit is March 2025.<BR><BR>Financial Snapshot:<BR>Net Sales: 13,851 Cr (Quarterly Results - Mar 2025) <BR>Net Profit: 1,518 Cr (Quarterly Results - Mar 2025) <BR>Market Cap: INR 9,769 Cr (Mid Cap)<BR><BR>Key Metrics:<BR>P/E: 19.00 <BR>Industry P/E: 20 <BR>Dividend Yield: 0.94% <BR>Debt Equity: -0.69 <BR>Return on Equity: 18.88% <BR>Price to Book: 3.49 <BR><BR>Contact Details:<BR>Address: Flat No 103 Ground Floor, R Square Pandurangapuram Vishakapatnam Andhra Pradesh : 530003 <BR>Tel: 91-040-23310260/23310261 <BR>Email: avantiho@avantifeeds.com <BR>Website: http://www.avantifeeds.com

View full answer

Who are the top shareholders of the Avanti Feeds?

17-Jul-2025

The top shareholders of Avanti Feeds include Srinivasa Cystine Private Limited with 26.64%, Thai Union Group Public Company Limited with 24.21%, and mutual funds with 3.78%. Additionally, foreign institutional investors hold 7.59%, while individual investors account for 14.95%, with no pledged promoter holdings.

The top shareholders of Avanti Feeds include several key players. The largest shareholder is Srinivasa Cystine Private Limited, which holds 26.64% of the shares. Following that, the Thai Union Group Public Company Limited is the highest public shareholder with a stake of 24.21%. Additionally, mutual funds collectively hold 3.78% across 12 schemes, while foreign institutional investors (FIIs) own 7.59% through 149 different entities. Individual investors account for 14.95% of the shareholding. Overall, the majority of the shares are held by promoters, and there are no pledged promoter holdings.

View full answer

How big is Avanti Feeds?

24-Jul-2025

As of 24th July, Avanti Feeds Ltd. has a market capitalization of 10,281.00 Cr, with recent net sales of 5612.27 Cr and a net profit of 528.82 Cr.

As of 24th July, Avanti Feeds Ltd. has a market capitalization of 10,281.00 Cr, categorizing it as a Mid Cap company.<BR><BR>In the latest four quarters, Avanti Feeds reported Net Sales of 5612.27 Cr and a Net Profit of 528.82 Cr.<BR><BR>The latest annual period for the balance sheet is March 2025, with Shareholder's Funds amounting to 2,800.96 Cr and Total Assets totaling 3,682.70 Cr.

View full answer

Is Avanti Feeds overvalued or undervalued?

19-Nov-2025

As of November 18, 2025, Avanti Feeds is considered fairly valued with a PE Ratio of 16.88, an EV to EBITDA of 10.32, and a PEG Ratio of 0.35, indicating strong growth potential, while its stock performance has outpaced the Sensex with a 1-year return of 25.66%.

As of 18 November 2025, the valuation grade for Avanti Feeds has moved from very attractive to attractive. The company is currently assessed as fairly valued. Key ratios include a PE Ratio of 16.88, an EV to EBITDA of 10.32, and a PEG Ratio of 0.35, which indicates strong growth potential relative to its price. <BR><BR>In comparison to peers, Avanti Feeds' PE Ratio is significantly lower than that of Apex Frozen Foods at 43.93, while Mukka Proteins, which is rated very attractive, has a PE Ratio of 15.56. This suggests that Avanti Feeds is competitively priced within its sector. Additionally, the company's recent stock performance has outpaced the Sensex, with a 1-year return of 25.66% compared to the Sensex's 9.48%, reinforcing the notion that it is fairly valued given its growth prospects.

View full answer

How has been the historical performance of Avanti Feeds?

04-Dec-2025

Avanti Feeds has shown consistent growth in net sales and profitability, with net sales increasing from ₹4,100.56 Cr in Mar'21 to ₹5,600.32 Cr in Mar'25, and profit after tax rising from ₹397.81 Cr to ₹556.80 Cr during the same period. The company's earnings per share improved from 26.44 to 38.83, reflecting strong financial performance and operational efficiency.

Answer:<BR>The historical performance of Avanti Feeds shows a consistent growth trend in net sales and profitability over the years.<BR><BR>Breakdown:<BR>Avanti Feeds has demonstrated a steady increase in net sales, rising from 4,100.56 Cr in Mar'21 to 5,600.32 Cr in Mar'25. This growth is accompanied by a rise in total operating income, which reached 5,600.32 Cr in Mar'25, up from 4,100.56 Cr in Mar'21. The company's operating profit (PBDIT) also reflects this positive trend, increasing from 552.72 Cr in Mar'21 to 798.51 Cr in Mar'25, while the profit before tax rose from 510.11 Cr in Mar'21 to 737.24 Cr in Mar'25. Consequently, the profit after tax saw a significant increase, reaching 556.80 Cr in Mar'25 compared to 397.81 Cr in Mar'21. The earnings per share (EPS) improved notably from 26.44 in Mar'21 to 38.83 in Mar'25. On the balance sheet, total assets grew from 2,279.61 Cr in Mar'21 to 3,682.70 Cr in Mar'25, indicating a robust asset base. Total liabilities also increased, but at a slower pace, from 2,279.61 Cr in Mar'21 to 3,682.70 Cr in Mar'25. The cash flow from operating activities improved significantly, reaching 584.00 Cr in Mar'25, compared to 382.00 Cr in Mar'21, reflecting enhanced operational efficiency. Overall, Avanti Feeds has shown strong financial performance with increasing revenues, profits, and asset growth over the years.

View full answer

Is Avanti Feeds technically bullish or bearish?

05-Dec-2025

As of December 4, 2025, Avanti Feeds shows a mildly bullish trend supported by positive weekly MACD, Bollinger Bands, and OBV, despite some caution from monthly indicators and short-term bearish signals.

As of 4 December 2025, the technical trend for Avanti Feeds has changed from sideways to mildly bullish. The weekly MACD is bullish, supporting the positive trend, while the monthly MACD shows a mildly bearish stance, indicating some caution. The weekly Bollinger Bands are bullish, reinforcing the upward momentum, and the KST is also bullish on the weekly timeframe. However, the daily moving averages are mildly bearish, suggesting short-term weakness. The weekly OBV is bullish, indicating strong buying pressure. Overall, the current technical stance is mildly bullish, driven primarily by the bullish signals from the weekly MACD, Bollinger Bands, and OBV, despite some mixed signals from the monthly indicators.

View full answer

When is the next results date for Avanti Feeds Ltd.?

28-Jan-2026

The next results date for Avanti Feeds Ltd. is 11 February 2026.

The next results date for Avanti Feeds Ltd. is scheduled for 11 February 2026.

View full answer

Are Avanti Feeds Ltd. latest results good or bad?

11-Feb-2026

Avanti Feeds Ltd.'s latest results show a 10.48% year-on-year profit growth and improved operating margins, but a concerning 14.01% quarter-on-quarter decline in net sales indicates potential challenges in the aquaculture sector. Investors should consider these mixed signals when evaluating the company's performance.

Avanti Feeds Ltd.'s latest results present a mixed picture. On one hand, the company reported a year-on-year growth in consolidated net profit of 10.48%, which is a positive sign of profitability. Additionally, the operating margin improved to 12.72%, reflecting better operational efficiency.<BR><BR>However, there are significant concerns regarding the quarter's performance. Net sales experienced a notable decline of 14.01% quarter-on-quarter, although they did show a slight increase of 1.31% compared to the same quarter last year. This sequential revenue contraction indicates potential challenges in the operating environment, particularly in the aquaculture sector, which is subject to seasonal fluctuations.<BR><BR>Overall, while the profitability metrics are encouraging, the sharp revenue decline and margin compression warrant careful monitoring. Investors should be aware of these mixed signals as they assess the company's performance and outlook.

View full answer

Should I buy, sell or hold Avanti Feeds Ltd.?

24-Mar-2026

Why is Avanti Feeds Ltd. falling/rising?

24-Mar-2026

As of 24-Mar, Avanti Feeds Ltd. is seeing its stock price rise to 1,181.50, up 6.29%, driven by strong financial performance, positive sector trends, and increased institutional investment. Despite recent short-term declines, the stock has delivered a 41.95% return year-to-date, reflecting solid fundamentals and market confidence.

As of 24-Mar, Avanti Feeds Ltd. is experiencing a rise in its stock price, currently at 1,181.50, reflecting an increase of 69.9 points or 6.29%. This upward movement is supported by several factors. Firstly, the stock opened with a gain of 2.64% today and reached an intraday high of Rs 1200, which is a 7.95% increase. Additionally, the aquaculture sector, in which Avanti Feeds operates, has gained by 6.12%, contributing to the positive sentiment around the stock.<BR><BR>Moreover, the company has demonstrated strong financial performance, with a return on equity (ROE) of 20.5% and a significant profit increase of 31.4% over the past year, which has led to a favorable price-to-earnings growth (PEG) ratio of 0.8. Institutional investors have also shown increasing participation, raising their stake by 0.97% in the previous quarter, indicating confidence in the company's fundamentals.<BR><BR>Despite some recent underperformance over shorter periods, such as a 5.22% decline over the past week and an 11.39% drop over the past month, the stock has generated a robust 41.95% return year-to-date and 26.68% over the past year. This consistent performance over longer periods, along with high management efficiency and a low debt-to-equity ratio, supports the stock's current rise. Overall, the combination of sector performance, institutional interest, and solid financial metrics contributes to the upward movement of Avanti Feeds Ltd.'s stock price.

View full answer
iScoreScore
Click here to find our call on this stock
Strong Sell
Sell
Hold
Buy
Strong Buy

Dashboard

1

High Management Efficiency with a high ROE of 16.10%

 
2

Company has a low Debt to Equity ratio (avg) at 0 times

 
3

Poor long term growth as Net Sales has grown by an annual rate of 8.18% and Operating profit at 8.75% over the last 5 years

 
4

Flat results in Dec 25

5

With ROE of 20.5, it has a Fair valuation with a 5.7 Price to Book Value

6

Increasing Participation by Institutional Investors

7

Consistent Returns over the last 3 years

stock-summaryMojo Parameters

Mojo Parameters

Loading Valuation Snapshot...

Stock DNA

stock-summary
Industry

FMCG

stock-summary
Market cap

INR 16,574 Cr (Small Cap)

stock-summary
P/E

27.00

stock-summary
Industry P/E

24

stock-summary
Dividend Yield

0.76%

stock-summary
Debt Equity

-0.91

stock-summary
Return on Equity

20.54%

stock-summary
Price to Book

5.35

Revenue and Profits:
Net Sales:
1,384 Cr
(Quarterly Results - Dec 2025)
Net Profit:
149 Cr
stock-summaryTotal Returns
Total Returns (Price + Dividend) stock-summary
Dividend Yield (0.76%)
TimePeriod
Price Return
Dividend Return
Total Return
3 Months
53.14%
0%
53.14%
6 Months
87.57%
0%
87.57%
1 Year
36.29%
1.03%
37.32%
2 Years
151.5%
2.98%
154.48%
3 Years
275.84%
6.19%
282.03%
4 Years
196.19%
5.90%
202.09%
5 Years
192.02%
6.96%
198.98%

Latest dividend: 9 per share ex-dividend date: Aug-07-2025

Risk Adjusted Returns v/s stock-summary
Returns Beta
Icon
Beta has not been calculated since enough price history is not available
stock-summaryNews & Corporate Actions

News

Why is Avanti Feeds Ltd. falling/rising?

Stock Performance Outshines Benchmarks

Avanti Feeds has demonstrated remarkable resilience and growth compared to broader market indices. Over the year to date, the stock has surged by 51.11%, vastly outperforming the Sensex, which declined by 11.67% in the same period. This outperformance extends over longer horizons as well, with the company delivering a 36.29% return over the past year against the Sensex’s modest 3.52% decline. Even over three and five years, Avanti Feeds has generated extraordinary returns of 275.84% and 192.02% respectively, dwarfing the Sensex’s 30.85% and 55.39% gains. Such sustained outperformance underscores the company’s strong market position and investor appeal.

Recent Trading Activity and Market Sentiment

On the day...

Read full news article
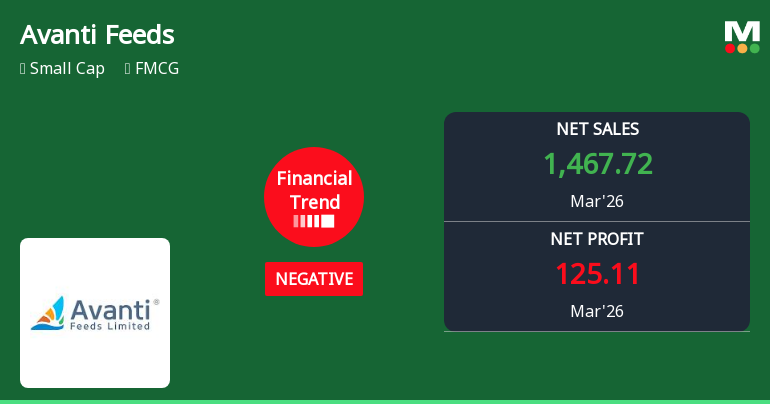
Announcements stock-summary

Closure of Trading Window

24-Mar-2026 | Source : BSE

As enclosed

Disclosures under Reg. 29(1) of SEBI (SAST) Regulations 2011

12-Mar-2026 | Source : BSE

The Exchange has received the disclosure under Regulation 29(1) of SEBI (Substantial Acquisition of Shares & Takeovers) Regulations 2011 for Kotak Mahindra Mutual Fund

Announcement under Regulation 30 (LODR)-Earnings Call Transcript

07-Mar-2026 | Source : BSE

As enclosed

Corporate Actions stock-summary

stock-summary
BOARD MEETING

No Upcoming Board Meetings

stock-summary
DIVIDEND

Avanti Feeds Ltd. has declared 900% dividend, ex-date: 07 Aug 25

stock-summary
SPLITS

Avanti Feeds Ltd. has announced 1:2 stock split, ex-date: 26 Jun 18

stock-summary
BONUS

Avanti Feeds Ltd. has announced 1:2 bonus issue, ex-date: 26 Jun 18

stock-summary
RIGHTS

No Rights history available

stock-summaryKey Factors

Quality key factors stock-summary

Factor
Value
Sales Growth (5y)
8.18%
EBIT Growth (5y)
8.75%
EBIT to Interest (avg)
100.00
Debt to EBITDA (avg)
Net Debt is too low
Net Debt to Equity (avg)
-0.91
Sales to Capital Employed (avg)
2.34
Tax Ratio
25.74%
Dividend Payout Ratio
23.19%
Pledged Shares
0
Institutional Holding
14.86%
ROCE (avg)
73.75%
ROE (avg)
16.10%

Valuation key factors

Factor
Value
P/E Ratio
27
Industry P/E
24
Price to Book Value
5.69
EV to EBIT
20.60
EV to EBITDA
18.91
EV to Capital Employed
54.82
EV to Sales
2.41
PEG Ratio
0.86
Dividend Yield
0.72%
ROCE (Latest)
260.58%
ROE (Latest)
20.54%

Technicals key factors

Indicator
Weekly
Monthly
MACD
Bullish
Bullish
RSI
No Signal
Bearish
Bollinger Bands
Bullish
Mildly Bullish
Moving Averages
Bullish (Daily)
KST
Bullish
Mildly Bearish
Dow Theory
Mildly Bearish
No Trend
OBV
No Trend
No Trend
stock-summary Technical Indicator Scale: Bearish, Mildly Bearish, Sideways, Mildly Bullish, Bullish  Turned 
stock-summaryShareholding
Shareholding Snapshot : Dec 2025stock-summary
Shareholding Compare (%holding) stock-summary
Majority shareholders

Promoters

Pledged Promoter Holdings

None

Mutual Funds

Held by 10 Schemes (3.76%)

FIIs

Held by 191 FIIs (7.98%)

Promoter with highest holding

Srinivasa Cystine Private Limited (26.64%)

Highest Public shareholder

Thai Union Group Public Company Limited (24.21%)

Individual Investors Holdings

14.35%

stock-summaryFinancial
[
  {
    "link": "quarterly",
    "btn_text": "All Quarterly Results",
    "header": "Quarterly Results Snapshot (Consolidated) - Dec'25 - YoY",
    "rhs": [
      {
        "prefix": "Net Sales ",
        "suffix": "YoY Growth in quarter ended Dec 2025 is 1.31% vs 8.97% in Dec 2024",
        "dir": -1
      },
      {
        "prefix": "Consolidated Net Profit ",
        "suffix": "YoY Growth in quarter ended Dec 2025 is 10.48% vs 86.57% in Dec 2024",
        "dir": -1
      }
    ],
    "table": {
      "header": [
        "Dec'25",
        "Dec'24",
        "Change(%)"
      ],
      "body": [
        {
          "field": "Net Sales",
          "val1": "1,383.52",
          "val2": "1,365.63",
          "chgp": "1.31%",
          "chgp_class": "positive"
        },
        {
          "field": "Operating Profit (PBDIT) excl Other Income",
          "val1": "176.05",
          "val2": "160.48",
          "chgp": "9.70%",
          "chgp_class": "positive"
        },
        {
          "field": "Interest",
          "val1": "0.68",
          "val2": "0.52",
          "chgp": "30.77%",
          "chgp_class": "negative"
        },
        {
          "field": "Exceptional Items",
          "val1": "-0.12",
          "val2": "-0.21",
          "chgp": "42.86%",
          "chgp_class": "positive"
        },
        {
          "field": "Consolidate Net Profit",
          "val1": "149.38",
          "val2": "135.21",
          "chgp": "10.48%",
          "chgp_class": "positive"
        },
        {
          "field": "Operating Profit Margin (Excl OI)",
          "val1": "12.72%",
          "val2": "11.75%",
          "chgp": "0.97%",
          "chgp_class": "positive"
        }
      ]
    }
  },
  {
    "link": "half-yearly",
    "btn_text": "All Half Yearly Results",
    "header": "Half Yearly Results Snapshot (Consolidated) - Sep'25",
    "rhs": [
      {
        "prefix": "Net Sales ",
        "suffix": " Growth in half year ended Sep 2025 is 12.40% vs 1.03% in Sep 2024",
        "dir": 1
      },
      {
        "prefix": "Consolidated Net Profit ",
        "suffix": " Growth in half year ended Sep 2025 is 37.10% vs 33.90% in Sep 2024",
        "dir": 1
      }
    ],
    "table": {
      "header": [
        "Sep'25",
        "Sep'24",
        "Change(%)"
      ],
      "body": [
        {
          "field": "Net Sales",
          "val1": "3,216.05",
          "val2": "2,861.36",
          "chgp": "12.40%",
          "chgp_class": "positive"
        },
        {
          "field": "Operating Profit (PBDIT) excl Other Income",
          "val1": "408.43",
          "val2": "295.84",
          "chgp": "38.06%",
          "chgp_class": "positive"
        },
        {
          "field": "Interest",
          "val1": "0.94",
          "val2": "1.12",
          "chgp": "-16.07%",
          "chgp_class": "positive"
        },
        {
          "field": "Exceptional Items",
          "val1": "0.00",
          "val2": "0.00",
          "chgp": "",
          "chgp_class": "neutral"
        },
        {
          "field": "Consolidate Net Profit",
          "val1": "331.57",
          "val2": "241.84",
          "chgp": "37.10%",
          "chgp_class": "positive"
        },
        {
          "field": "Operating Profit Margin (Excl OI)",
          "val1": "12.70%",
          "val2": "10.34%",
          "chgp": "2.36%",
          "chgp_class": "positive"
        }
      ]
    }
  },
  {
    "link": "nine-monthly",
    "btn_text": "All Nine Monthly Results",
    "header": "Nine Monthly Results Snapshot (Consolidated) - Dec'25",
    "rhs": [
      {
        "prefix": "Net Sales ",
        "suffix": "YoY Growth in nine months ended Dec 2025 is 8.81% vs 3.47% in Dec 2024",
        "dir": 1
      },
      {
        "prefix": "Consolidated Net Profit ",
        "suffix": "YoY Growth in nine months ended Dec 2025 is 27.56% vs 48.98% in Dec 2024",
        "dir": -1
      }
    ],
    "table": {
      "header": [
        "Dec'25",
        "Dec'24",
        "Change(%)"
      ],
      "body": [
        {
          "field": "Net Sales",
          "val1": "4,599.57",
          "val2": "4,226.99",
          "chgp": "8.81%",
          "chgp_class": "positive"
        },
        {
          "field": "Operating Profit (PBDIT) excl Other Income",
          "val1": "584.48",
          "val2": "456.32",
          "chgp": "28.09%",
          "chgp_class": "positive"
        },
        {
          "field": "Interest",
          "val1": "1.62",
          "val2": "1.64",
          "chgp": "-1.22%",
          "chgp_class": "positive"
        },
        {
          "field": "Exceptional Items",
          "val1": "-0.12",
          "val2": "-0.21",
          "chgp": "42.86%",
          "chgp_class": "positive"
        },
        {
          "field": "Consolidate Net Profit",
          "val1": "480.95",
          "val2": "377.05",
          "chgp": "27.56%",
          "chgp_class": "positive"
        },
        {
          "field": "Operating Profit Margin (Excl OI)",
          "val1": "12.71%",
          "val2": "10.80%",
          "chgp": "1.91%",
          "chgp_class": "positive"
        }
      ]
    }
  },
  {
    "link": "annual",
    "btn_text": "All Annual Results",
    "header": "Annual Results Snapshot (Consolidated) - Mar'25",
    "rhs": [
      {
        "prefix": "Net Sales ",
        "suffix": "YoY Growth in year ended Mar 2025 is 4.28% vs 5.54% in Mar 2024",
        "dir": -1
      },
      {
        "prefix": "Consolidated Net Profit ",
        "suffix": "YoY Growth in year ended Mar 2025 is 48.07% vs 28.16% in Mar 2024",
        "dir": 1
      }
    ],
    "table": {
      "header": [
        "Mar'25",
        "Mar'24",
        "Change(%)"
      ],
      "body": [
        {
          "field": "Net Sales",
          "val1": "5,598.69",
          "val2": "5,368.89",
          "chgp": "4.28%",
          "chgp_class": "positive"
        },
        {
          "field": "Operating Profit (PBDIT) excl Other Income",
          "val1": "632.23",
          "val2": "458.08",
          "chgp": "38.02%",
          "chgp_class": "positive"
        },
        {
          "field": "Interest",
          "val1": "2.25",
          "val2": "1.31",
          "chgp": "71.76%",
          "chgp_class": "negative"
        },
        {
          "field": "Exceptional Items",
          "val1": "0.17",
          "val2": "0.00",
          "chgp": "",
          "chgp_class": "neutral"
        },
        {
          "field": "Consolidate Net Profit",
          "val1": "528.82",
          "val2": "357.14",
          "chgp": "48.07%",
          "chgp_class": "positive"
        },
        {
          "field": "Operating Profit Margin (Excl OI)",
          "val1": "11.29%",
          "val2": "8.53%",
          "chgp": "2.76%",
          "chgp_class": "positive"
        }
      ]
    }
  }
]

Quarterly Results Snapshot (Consolidated) - Dec'25 - YoYstock-summary

Dec'25
Dec'24
Change(%)
Net Sales
1,383.52
1,365.63
1.31%
Operating Profit (PBDIT) excl Other Income
176.05
160.48
9.70%
Interest
0.68
0.52
30.77%
Exceptional Items
-0.12
-0.21
42.86%
Consolidate Net Profit
149.38
135.21
10.48%
Operating Profit Margin (Excl OI)
12.72%
11.75%
0.97%
Values in Rs Cr.
Direction Arrows
Net Sales

YoY Growth in quarter ended Dec 2025 is 1.31% vs 8.97% in Dec 2024

Direction Arrows
Consolidated Net Profit

YoY Growth in quarter ended Dec 2025 is 10.48% vs 86.57% in Dec 2024

Half Yearly Results Snapshot (Consolidated) - Sep'25stock-summary

Sep'25
Sep'24
Change(%)
Net Sales
3,216.05
2,861.36
12.40%
Operating Profit (PBDIT) excl Other Income
408.43
295.84
38.06%
Interest
0.94
1.12
-16.07%
Exceptional Items
0.00
0.00
Consolidate Net Profit
331.57
241.84
37.10%
Operating Profit Margin (Excl OI)
12.70%
10.34%
2.36%
Values in Rs Cr.
Direction Arrows
Net Sales

Growth in half year ended Sep 2025 is 12.40% vs 1.03% in Sep 2024

Direction Arrows
Consolidated Net Profit

Growth in half year ended Sep 2025 is 37.10% vs 33.90% in Sep 2024

Nine Monthly Results Snapshot (Consolidated) - Dec'25stock-summary

Dec'25
Dec'24
Change(%)
Net Sales
4,599.57
4,226.99
8.81%
Operating Profit (PBDIT) excl Other Income
584.48
456.32
28.09%
Interest
1.62
1.64
-1.22%
Exceptional Items
-0.12
-0.21
42.86%
Consolidate Net Profit
480.95
377.05
27.56%
Operating Profit Margin (Excl OI)
12.71%
10.80%
1.91%
Values in Rs Cr.
Direction Arrows
Net Sales

YoY Growth in nine months ended Dec 2025 is 8.81% vs 3.47% in Dec 2024

Direction Arrows
Consolidated Net Profit

YoY Growth in nine months ended Dec 2025 is 27.56% vs 48.98% in Dec 2024

Annual Results Snapshot (Consolidated) - Mar'25stock-summary

Mar'25
Mar'24
Change(%)
Net Sales
5,598.69
5,368.89
4.28%
Operating Profit (PBDIT) excl Other Income
632.23
458.08
38.02%
Interest
2.25
1.31
71.76%
Exceptional Items
0.17
0.00
Consolidate Net Profit
528.82
357.14
48.07%
Operating Profit Margin (Excl OI)
11.29%
8.53%
2.76%
Values in Rs Cr.
Direction Arrows
Net Sales

YoY Growth in year ended Mar 2025 is 4.28% vs 5.54% in Mar 2024

Direction Arrows
Consolidated Net Profit

YoY Growth in year ended Mar 2025 is 48.07% vs 28.16% in Mar 2024

stock-summaryCompany CV
About Avanti Feeds Ltd. stock-summary
stock-summary
Avanti Feeds Ltd.
Small Cap
FMCG
Avanti Feeds Limited (AFL) has marked its presence in the field of aquaculture by engaging in manufacturing high-quality feed for shrimps, operating the Vannamei hatchery and processing and exporting shrimps. The company has a strong technical tie-up with the THAI UNION Group of Thailand in the field of aquaculture. The company started its commercial operations in 1993 and now stands as the leading manufacturer of Shrimp Feed. Avanti Feeds operates a 3.
Company Coordinates stock-summary
Company Details
Flat No 103 Ground Floor, R Square Pandurangapuram Vishakapatnam Andhra Pradesh : 530003
stock-summary
Tel: 91-040-23310260/23310261
stock-summary
avantiho@avantifeeds.com
Registrar Details
Karvy Computershare Pvt Ltd., Karvy Selenium, Tower-B Plot No 31 & 32, Survey No 116/22, 115/24, 115/25, Financial District, Nanakramguda, Serilingampally, Mandal Ranga Reddy Dist, Hyderabad