
Compare Honasa Consumer with Similar Stocks
Dashboard
The company is Net-Debt Free
Healthy long term growth as Operating profit has grown by an annual rate 34.20%
With a growth in Net Profit of 38.51%, the company declared Very Positive results in Mar 26
With ROE of 14.4, it has a Fair valuation with a 9.6 Price to Book Value
High Institutional Holdings at 32.98%
Total Returns (Price + Dividend) 
Honasa Consumer for the last several years.
Risk Adjusted Returns v/s
Returns Beta

News

Honasa Consumer Ltd is Rated Buy by MarketsMOJO
Honasa Consumer Ltd is rated 'Buy' by MarketsMOJO, with this rating last updated on 15 June 2026. While the rating change occurred on that date, the analysis and financial metrics discussed here reflect the company’s current position as of 19 June 2026, providing investors with the most up-to-date insight into the stock’s performance and outlook.
Read full news article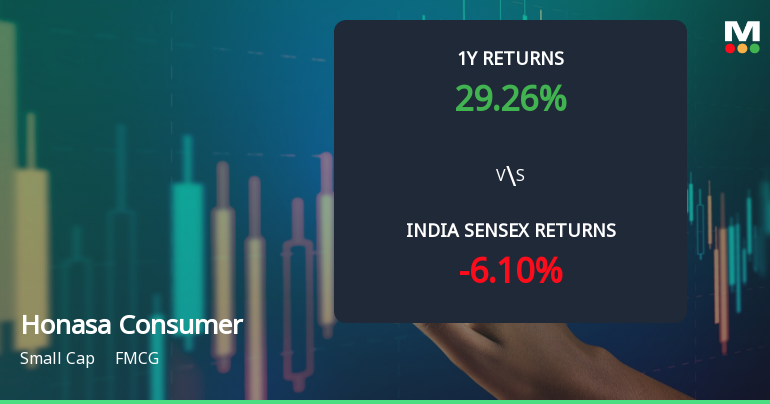
Honasa Consumer Ltd Technical Momentum Shifts Amid Mixed Market Signals
Honasa Consumer Ltd, a small-cap player in the FMCG sector, has experienced a notable shift in its technical momentum, moving from a mildly bullish stance to a more confident bullish trend. Despite a modest day decline of 1.65%, the stock’s broader technical indicators reveal a complex interplay of signals that investors should carefully consider.
Read full news article
Honasa Consumer Ltd Technical Momentum Shifts Amid Mixed Market Signals
Honasa Consumer Ltd, a small-cap player in the FMCG sector, has experienced a notable shift in its technical momentum, moving from a bullish to a mildly bullish stance. Despite a recent dip in price, the stock’s technical indicators present a complex picture, with some signals pointing to caution while others suggest underlying strength. This analysis delves into the latest technical parameters, price action, and comparative returns to provide a comprehensive view for investors.
Read full news article Announcements
Announcement under Regulation 30 (LODR)-Allotment of ESOP / ESPS
15-Jun-2026 | Source : BSEAllotment of 654422 equity shares of face value of Rs. 10/- each upon exercise of vested stock options by employees
Announcement under Regulation 30 (LODR)-Investor Presentation
10-Jun-2026 | Source : BSEInvestor Day 2026 - Presentation
Revised Code Of Practices And Procedures For Fair Disclosure Of Unpublished Price Sensitive Information
22-May-2026 | Source : BSERevised Code of Practices and Procedures for Fair Disclosure of Unpublished Price Sensitive Information
Corporate Actions

No Upcoming Board Meetings

No Dividend history available

No Splits history available

No Bonus history available

No Rights history available
Quality key factors
Valuation key factors
Technicals key factors
 Technical Indicator Scale: Bearish, Mildly Bearish, Sideways, Mildly Bullish, Bullish Turned
 Shareholding Snapshot : Mar 2026
Shareholding Compare (%holding)
Promoters
4.1505
Held by 18 Schemes (3.44%)
Held by 101 FIIs (13.74%)
Varun Alagh (32.45%)
Peak Xv Partners Investments Vi (14.83%)
6.83%
Quarterly Results Snapshot (Consolidated) - Mar'26 - QoQ

QoQ Growth in quarter ended Mar 2026 is 9.23% vs 11.80% in Dec 2025

QoQ Growth in quarter ended Mar 2026 is 37.83% vs 27.96% in Dec 2025
Half Yearly Results Snapshot (Consolidated) - Sep'25
Growth in half year ended Sep 2025 is 11.56% vs 5.75% in Sep 2024
Growth in half year ended Sep 2025 is 271.54% vs -60.87% in Sep 2024
Nine Monthly Results Snapshot (Consolidated) - Dec'25
YoY Growth in nine months ended Dec 2025 is 13.14% vs 5.84% in Dec 2024
YoY Growth in nine months ended Dec 2025 is 174.11% vs -41.33% in Dec 2024
Annual Results Snapshot (Consolidated) - Mar'26
YoY Growth in year ended Mar 2026 is 15.72% vs 7.66% in Mar 2025
YoY Growth in year ended Mar 2026 is 175.07% vs -34.97% in Mar 2025
About Honasa Consumer Ltd

Company Coordinates


