
Compare Godrej Agrovet with Similar Stocks
Total Returns (Price + Dividend) 
Latest dividend: 11 per share ex-dividend date: Jul-31-2025
Risk Adjusted Returns v/s
Returns Beta

News

Godrej Agrovet Ltd: Valuation Shifts Signal Renewed Price Attractiveness Amid Mixed Returns
Godrej Agrovet Ltd., a prominent player in the FMCG sector, has seen a notable shift in its valuation parameters, moving from an attractive to a very attractive rating. Despite recent market headwinds and a 1.43% decline in its share price on 9 Jul 2026, the company’s improved price-to-earnings and price-to-book ratios suggest enhanced price attractiveness relative to its historical and peer benchmarks.
Read full news article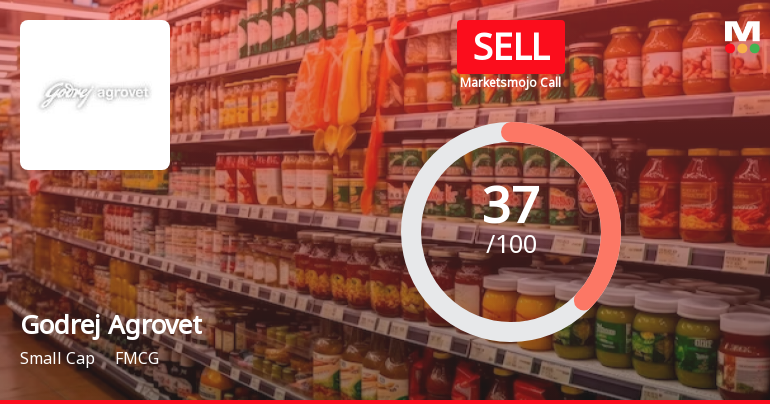
Godrej Agrovet Ltd. is Rated Sell
Godrej Agrovet Ltd. is rated Sell by MarketsMOJO, with this rating last updated on 13 Oct 2025. However, the analysis and financial metrics presented here reflect the stock’s current position as of 05 July 2026, providing investors with an up-to-date perspective on the company’s fundamentals, returns, and market performance.
Read full news article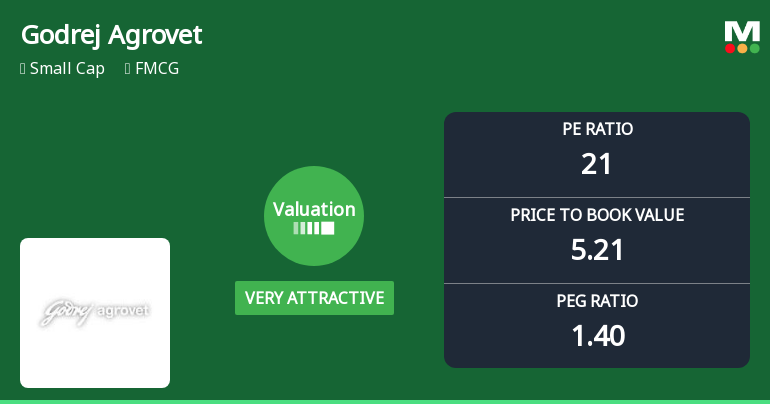
Godrej Agrovet Ltd: Valuation Shifts Signal Renewed Price Attractiveness Amid Mixed Returns
Godrej Agrovet Ltd., a key player in the FMCG sector, has witnessed a notable shift in its valuation parameters, moving from an attractive to a very attractive price range. This re-rating comes amid a backdrop of subdued stock performance and sector-wide volatility, prompting investors to reassess the company’s price attractiveness relative to its historical averages and peer group.
Read full news article Announcements
Godrej Agrovet Limited - Registrar & Share Transfer Agent Update
09-Dec-2019 | Source : NSEGodrej Agrovet Limited has informed the Exchange regarding the Registrar & Share Transfer Agent Update that we are in receipt of intimation from our Registrar and Share Transfer Agent ( RTA ) vide email dated December 6, 2019, that it has changed its name from KARVY FINTECH PRIVATE LIMITED to KFIN TECHNOLOGIES PRIVATE LIMITED . We have been further informed that the above change is effective from December 5, 2019. Further, kindly note that all other details pertaining to RTA will remain unchanged.
Godrej Agrovet Limited - Outcome of Board Meeting
05-Nov-2019 | Source : NSEGodrej Agrovet Limited has informed the Exchange regarding Outcome of Board Meeting held on November 04, 2019.
Godrej Agrovet Limited - Updates
04-Nov-2019 | Source : NSEGodrej Agrovet Limited has informed the Exchange regarding 'further to the announcement made by the Company on October 22, 2019 regarding sanctioning of the Scheme of Amalgamation of Creamline Dairy Products Limited ( CDPL / Transferee Company ) [our material unlisted subsidiary] with Nagavalli Milkline Private Limited ( NMPL /Transferor Company ) [unlisted wholly-owned subsidiary of CDPL] and their respective shareholders pursuant to Section 230 to 232 and other applicable provisions of the Companies Act 2013 ( Scheme ), by the Hon'ble National Company Law Tribunal, Hyderabad Bench ('NCLT') on October 17, 2019, we wish to inform you that the Scheme has become effective post filing of e-Form INC-28 by the Transferror and Transferee on October 31, 2019 with the Registrar of Companies, Hyderabad.
Corporate Actions

No Upcoming Board Meetings

Godrej Agrovet Ltd. has declared 110% dividend, ex-date: 29 Jul 26

No Splits history available

No Bonus history available

No Rights history available
Quality key factors
Valuation key factors
Technicals key factors
 Technical Indicator Scale: Bearish, Mildly Bearish, Sideways, Mildly Bullish, Bullish Turned
 Shareholding Snapshot : Mar 2026
Shareholding Compare (%holding)
Promoters
None
Held by 14 Schemes (4.0%)
Held by 88 FIIs (3.84%)
Godrej Industries Limited (65.05%)
V-sciences Investments Pte Ltd (2.48%)
12.59%
Quarterly Results Snapshot (Consolidated) - Mar'26 - YoY

YoY Growth in quarter ended Mar 2026 is 9.33% vs -0.03% in Mar 2025
YoY Growth in quarter ended Mar 2026 is 48.14% vs 23.89% in Mar 2025
Half Yearly Results Snapshot (Consolidated) - Sep'25
Growth in half year ended Sep 2025 is 7.96% vs -5.54% in Sep 2024

Growth in half year ended Sep 2025 is 2.29% vs 17.44% in Sep 2024
Nine Monthly Results Snapshot (Consolidated) - Dec'25
YoY Growth in nine months ended Dec 2025 is 8.98% vs -2.39% in Dec 2024
YoY Growth in nine months ended Dec 2025 is 2.50% vs 18.64% in Dec 2024
Annual Results Snapshot (Consolidated) - Mar'26
YoY Growth in year ended Mar 2026 is 9.06% vs -1.86% in Mar 2025
YoY Growth in year ended Mar 2026 is 10.02% vs 19.48% in Mar 2025
About Godrej Agrovet Ltd.

Company Coordinates


