
Compare The Bombay Burma with Similar Stocks
Dashboard
Poor long term growth as Net Sales has grown by an annual rate of 7.84% and Operating profit at 7.04% over the last 5 years
Flat results in Mar 26
With ROE of 16.5, it has a Very Expensive valuation with a 1.5 Price to Book Value
Despite the size of the company, domestic mutual funds hold only 1.67% of the company
Below par performance in long term as well as near term
Total Returns (Price + Dividend) 
Latest dividend: 16.933221099887767 per share ex-dividend date: Feb-20-2026
Risk Adjusted Returns v/s
Returns Beta

News

The Bombay Burmah Trading Corporation Ltd Faces Bearish Momentum Amid Technical Downgrade
The Bombay Burmah Trading Corporation Ltd, a small-cap player in the FMCG sector, has experienced a notable shift in its technical momentum, moving from a mildly bearish stance to a more pronounced bearish trend. Recent technical indicators, including MACD, RSI, and moving averages, signal increasing downside pressure, coinciding with a 2.17% decline in the stock price on 9 Jul 2026. This article analyses the evolving technical landscape and its implications for investors.
Read full news article
The Bombay Burmah Trading Corporation Ltd is Rated Sell
The Bombay Burmah Trading Corporation Ltd is rated 'Sell' by MarketsMOJO, with this rating last updated on 29 December 2025. However, the analysis and financial metrics discussed here reflect the stock's current position as of 05 July 2026, providing investors with an up-to-date perspective on the company’s fundamentals, valuation, financial trends, and technical outlook.
Read full news article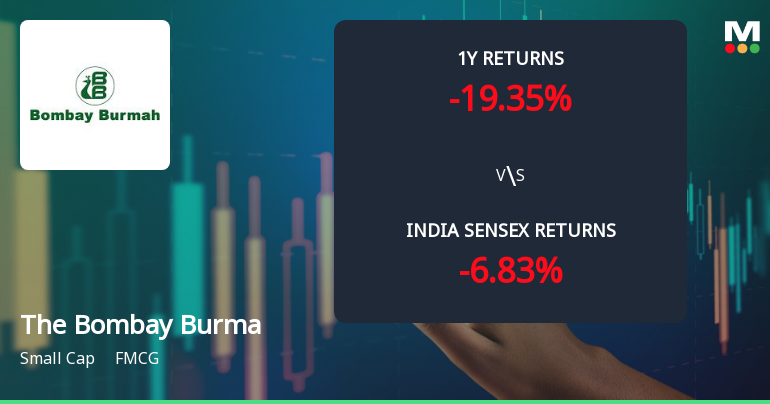
The Bombay Burmah Trading Corporation Ltd: Technical Momentum Shifts Amid Mixed Market Signals
The Bombay Burmah Trading Corporation Ltd has recently experienced a notable shift in its technical momentum, moving from a sideways trend to a mildly bearish stance. Despite some bullish weekly indicators, monthly signals suggest caution, reflecting a complex interplay of market forces for this small-cap FMCG player.
Read full news article Announcements
Bombay Burmah Trading Corporation Limited - Resignation
18-Nov-2019 | Source : NSEBombay Burmah Trading Corporation Limited has informed the Exchange regarding Resignation of Mr Dibakar Chatterjee as Chief Executive Officer of the company w.e.f. November 23, 2019.
Bombay Burmah Trading Corporation Limited - Appointment
06-Nov-2019 | Source : NSEBombay Burmah Trading Corporation Limited has informed the Exchange regarding Appointment of Mr Sanjay Kumar Chowdhary as Company Secretary & Compliance Officer of the company w.e.f. November 05, 2019.
Spurt in Volume
28-Aug-2019 | Source : NSE
| Significant increase in volume has been observed in Bombay Burmah Trading Corporation Limited. The Exchange, in order to ensure that investors have latest relevant information about the company and to inform the market place so that the interest of the investors is safeguarded, had written to the company. Bombay Burmah Trading Corporation Limited has submitted their response. |
Corporate Actions

No Upcoming Board Meetings

The Bombay Burmah Trading Corporation Ltd has declared 850% dividend, ex-date: 20 Feb 26

The Bombay Burmah Trading Corporation Ltd has announced 2:10 stock split, ex-date: 08 Nov 12

No Bonus history available

No Rights history available
Quality key factors
Valuation key factors
Technicals key factors
 Technical Indicator Scale: Bearish, Mildly Bearish, Sideways, Mildly Bullish, Bullish Turned
 Shareholding Snapshot : Mar 2026
Shareholding Compare (%holding)
Promoters
None
Held by 16 Schemes (0.43%)
Held by 171 FIIs (9.49%)
Nowrosjee Wadia & Sons Limited (41.95%)
Acacia Institutional Partners, Lp (1.5%)
11.65%
Quarterly Results Snapshot (Consolidated) - Mar'26 - QoQ

QoQ Growth in quarter ended Mar 2026 is -4.89% vs 2.49% in Dec 2025

QoQ Growth in quarter ended Mar 2026 is 40.35% vs 30.89% in Dec 2025
Half Yearly Results Snapshot (Consolidated) - Sep'25
Growth in half year ended Sep 2025 is 6.16% vs 5.62% in Sep 2024
Growth in half year ended Sep 2025 is 1.55% vs 1,491.74% in Sep 2024
Nine Monthly Results Snapshot (Consolidated) - Dec'25
YoY Growth in nine months ended Dec 2025 is 6.83% vs 6.43% in Dec 2024
YoY Growth in nine months ended Dec 2025 is -1.88% vs 92.63% in Dec 2024
Annual Results Snapshot (Consolidated) - Mar'26
YoY Growth in year ended Mar 2026 is 6.78% vs 6.95% in Mar 2025
YoY Growth in year ended Mar 2026 is 10.69% vs 76.35% in Mar 2025
About The Bombay Burmah Trading Corporation Ltd

Company Coordinates


