
Compare Godrej Agrovet with Similar Stocks
Total Returns (Price + Dividend) 
Latest dividend: 11 per share ex-dividend date: Jul-31-2025
Risk Adjusted Returns v/s
Returns Beta

News

Godrej Agrovet Ltd. is Rated Sell
Godrej Agrovet Ltd. is rated 'Sell' by MarketsMOJO, with this rating last updated on 13 Oct 2025. However, the analysis and financial metrics presented here reflect the stock’s current position as of 24 June 2026, providing investors with an up-to-date view of its performance and outlook.
Read full news article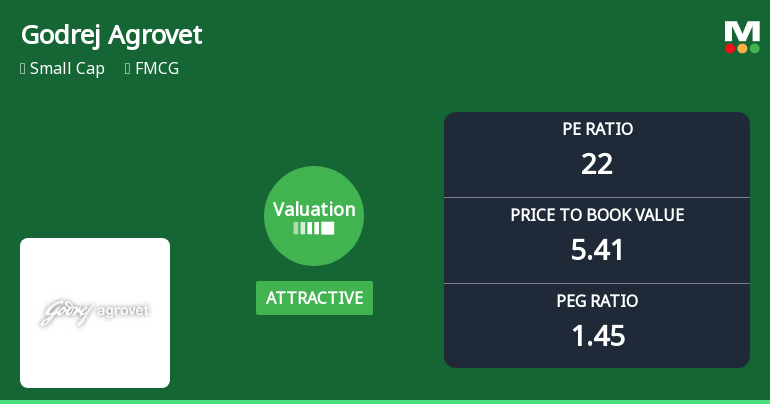
Godrej Agrovet Ltd: Valuation Shifts Signal Changing Price Attractiveness Amid FMCG Sector Dynamics
Godrej Agrovet Ltd., a notable player in the FMCG sector, has witnessed a significant shift in its valuation parameters, moving from a very attractive to an attractive rating. This change reflects evolving market perceptions and presents a nuanced picture of the stock’s price attractiveness relative to its historical averages and peer group. Investors and analysts are now re-evaluating the company’s prospects amid sectoral headwinds and broader market trends.
Read full news article
Godrej Agrovet Ltd. is Rated Sell by MarketsMOJO
Godrej Agrovet Ltd. is rated Sell by MarketsMOJO, with this rating last updated on 13 Oct 2025. However, the analysis and financial metrics discussed here reflect the stock's current position as of 13 June 2026, providing investors with an up-to-date view of the company’s fundamentals, returns, and market performance.
Read full news article Announcements
Intimation Of Cessation Of Senior Management Personnel
22-Jun-2026 | Source : BSEPlease find enclosed the details of cessation of Ms. Mallika Mutreja Head - Human Resources (Senior Management Personnel) of the Company.
Notice To Shareholders Regarding Transfer Of Unclaimed / Unpaid Dividend And Corresponding Equity Shares To Investor Education And Protection Fund (IEPF) Wherein Dividend Has Not Been Paid / Claimed For 7 (Seven) Consecutive Years
26-May-2026 | Source : BSEPlease find enclosed intimation of dispatch of notice of transfer of unclaimed / unpaid dividend and corresponding Equity Shraes to the Investors Education and Protection Fund
Announcement under Regulation 30 (LODR)-Newspaper Publication
26-May-2026 | Source : BSEPlease find enclosed copy of newspaper announcement published today i.e. on Tuesday May 26 2026 giving notice to the shareholders whose unpaid / unclaimed dividend and correspondent equity are liable to be transferred to IEPF.
Corporate Actions

No Upcoming Board Meetings

Godrej Agrovet Ltd. has declared 110% dividend, ex-date: 29 Jul 26

No Splits history available

No Bonus history available

No Rights history available
Quality key factors
Valuation key factors
Technicals key factors
 Technical Indicator Scale: Bearish, Mildly Bearish, Sideways, Mildly Bullish, Bullish Turned
 Shareholding Snapshot : Mar 2026
Shareholding Compare (%holding)
Promoters
None
Held by 14 Schemes (4.0%)
Held by 88 FIIs (3.84%)
Godrej Industries Limited (65.05%)
V-sciences Investments Pte Ltd (2.48%)
12.59%
Quarterly Results Snapshot (Consolidated) - Mar'26 - YoY

YoY Growth in quarter ended Mar 2026 is 9.33% vs -0.03% in Mar 2025
YoY Growth in quarter ended Mar 2026 is 48.14% vs 23.89% in Mar 2025
Half Yearly Results Snapshot (Consolidated) - Sep'25
Growth in half year ended Sep 2025 is 7.96% vs -5.54% in Sep 2024

Growth in half year ended Sep 2025 is 2.29% vs 17.44% in Sep 2024
Nine Monthly Results Snapshot (Consolidated) - Dec'25
YoY Growth in nine months ended Dec 2025 is 8.98% vs -2.39% in Dec 2024
YoY Growth in nine months ended Dec 2025 is 2.50% vs 18.64% in Dec 2024
Annual Results Snapshot (Consolidated) - Mar'26
YoY Growth in year ended Mar 2026 is 9.06% vs -1.86% in Mar 2025
YoY Growth in year ended Mar 2026 is 10.02% vs 19.48% in Mar 2025
About Godrej Agrovet Ltd.

Company Coordinates


