
Compare Cupid with Similar Stocks
Dashboard
The company is Net-Debt Free
Healthy long term growth as Operating profit has grown by an annual rate 30.35%
With a growth in Net Sales of 28.3%, the company declared Outstanding results in Mar 26
Consistent Returns over the last 3 years
With its market cap of Rs 28,507 cr, it is the biggest company in the sector and constitutes 72.87% of the entire sector
Total Returns (Price + Dividend) 
Latest dividend: 0.03 per share ex-dividend date: Sep-18-2023
Risk Adjusted Returns v/s
Returns Beta

News
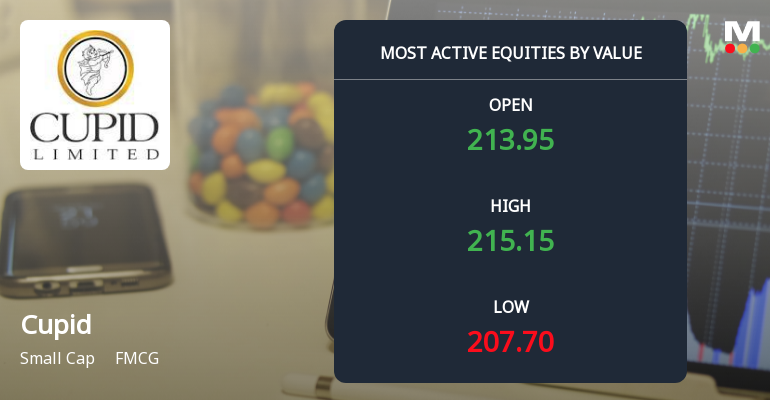
Cupid Ltd Sees High-Value Trading Amid Sector Underperformance and Institutional Interest
Cupid Ltd, a small-cap player in the FMCG sector, has emerged as one of the most actively traded stocks by value on 13 July 2026, reflecting significant institutional interest and robust market participation despite a slight intraday price dip. The stock’s trading activity, combined with its recent upgrade in rating and strong technical positioning, offers a compelling narrative for investors analysing liquidity and momentum in the FMCG space.
Read full news article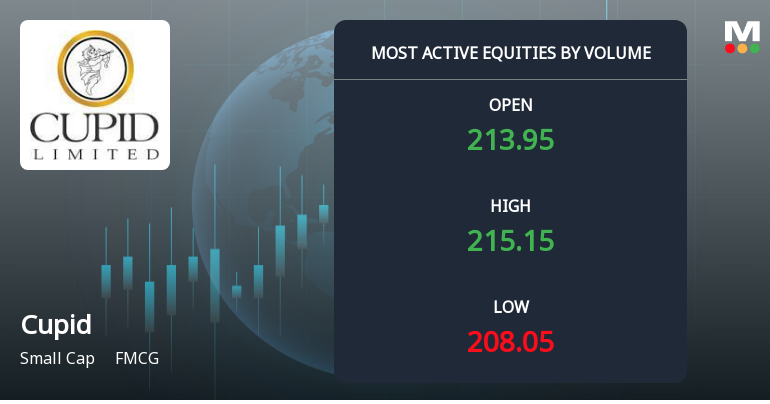
Cupid Ltd Sees Exceptional Volume Surge Amid Mixed Price Action
Cupid Ltd (CUPID), a small-cap player in the FMCG sector, witnessed one of the highest trading volumes on 13 Jul 2026, with over 1.43 crore shares exchanging hands. Despite a marginal dip in price, the stock’s volume surge and technical positioning suggest a complex interplay of accumulation and distribution signals that investors should carefully analyse.
Read full news article
Cupid Ltd Sees Robust Trading Activity Amid Strong Institutional Interest
Cupid Ltd, a small-cap player in the FMCG sector, has emerged as one of the most actively traded stocks by value on 10 July 2026, reflecting heightened investor interest and robust market participation. The stock’s strong performance, coupled with significant institutional buying and large order flows, underscores its growing appeal amid a competitive sector backdrop.
Read full news article Announcements
Cupid Limited - Other General Purpose
05-Dec-2019 | Source : NSECupid Limited has submitted to the Exchange a copy of Disclosure on Related Party Transactions for Half Year ended on September 30, 2019 pursuant to regulation 23(9) of SEBI (LODR) Regulations, 2015.
Cupid Limited - Analysts/Institutional Investor Meet/Con. Call Updates
18-Nov-2019 | Source : NSECupid Limited has informed the Exchange regarding Analysts/Institutional Investor Meet/Con. Call Updates - Postponement of Q2FY20 Conference Call.
Cupid Limited - Record Date
13-Nov-2019 | Source : NSECupid Limited has informed the Exchange that the Company has fixed Record Date as November 22, 2019 for the purpose of Dividend.
Corporate Actions

No Upcoming Board Meetings

Cupid Ltd has declared 30% dividend, ex-date: 18 Sep 23

Cupid Ltd has announced 1:10 stock split, ex-date: 04 Apr 24

Cupid Ltd has announced 4:1 bonus issue, ex-date: 09 Mar 26

No Rights history available
Quality key factors
Valuation key factors
Technicals key factors
 Technical Indicator Scale: Bearish, Mildly Bearish, Sideways, Mildly Bullish, Bullish Turned
 Shareholding Snapshot : Mar 2026
Shareholding Compare (%holding)
Non Institution
24.7852
Held by 1 Schemes (0.0%)
Held by 18 FIIs (0.91%)
Aditya Kumar Halwasiya (32.9%)
Setu Securities Pvt Ltd (3.6%)
24.74%
Quarterly Results Snapshot (Consolidated) - Mar'26 - QoQ

QoQ Growth in quarter ended Mar 2026 is 28.30% vs 10.72% in Dec 2025

QoQ Growth in quarter ended Mar 2026 is 10.45% vs 36.05% in Dec 2025
Half Yearly Results Snapshot (Consolidated) - Sep'25
Not Applicable: The company has declared_date for only one period
Not Applicable: The company has declared_date for only one period
Nine Monthly Results Snapshot (Consolidated) - Dec'25
YoY Growth in nine months ended Dec 2025 is 87.15% vs 21.43% in Dec 2024
YoY Growth in nine months ended Dec 2025 is 145.05% vs 131.08% in Dec 2024
Annual Results Snapshot (Consolidated) - Mar'26
YoY Growth in year ended Mar 2026 is 94.92% vs 7.27% in Mar 2025
YoY Growth in year ended Mar 2026 is 164.69% vs 2.61% in Mar 2025
About Cupid Ltd

Company Coordinates


