
Compare Foseco India with Similar Stocks
Dashboard
The company is Net-Debt Free
Healthy long term growth as Operating profit has grown by an annual rate 38.75%
Flat results in Mar 26
With ROE of 8.1, it has a Very Expensive valuation with a 3.8 Price to Book Value
Despite the size of the company, domestic mutual funds hold only 1.56% of the company
Consistent Returns over the last 3 years
Stock DNA
Specialty Chemicals
INR 3,927 Cr (Small Cap)
41.00
45
0.47%
-0.29
8.09%
3.85
Total Returns (Price + Dividend) 
Latest dividend: 25.061922018860837 per share ex-dividend date: Jun-03-2026
Risk Adjusted Returns v/s
Returns Beta

News

Foseco India Ltd. Upgraded to Hold as Technicals Improve Amid Flat Financials
Foseco India Ltd., a specialty chemicals company, has seen its investment rating upgraded from Sell to Hold as of 24 June 2026, reflecting a nuanced improvement across technical indicators and a steady financial trend despite flat recent quarterly results. The revised Mojo Score of 51.0 and a Hold grade signal cautious optimism amid valuation concerns and mixed technical signals.
Read full news article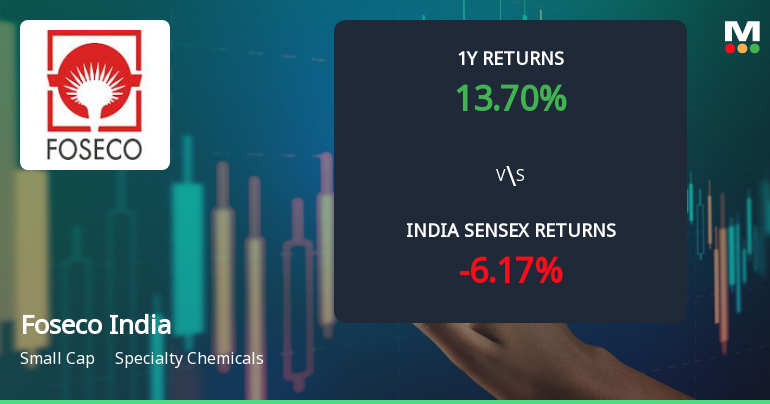
Foseco India Ltd. Exhibits Mildly Bullish Momentum Amid Technical Parameter Shift
Foseco India Ltd., a specialty chemicals company, has exhibited a notable shift in its technical momentum, moving from a sideways trend to a mildly bullish stance. This transition is underscored by mixed signals from key technical indicators such as MACD, RSI, Bollinger Bands, and moving averages, reflecting a nuanced market sentiment as the stock trades near ₹5,305.55, up 2.94% on 25 Jun 2026.
Read full news article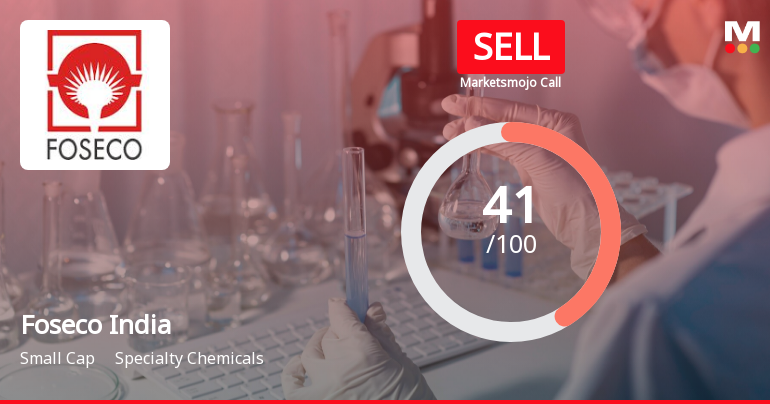
Foseco India Ltd. is Rated Sell
Foseco India Ltd. is rated Sell by MarketsMOJO, with this rating last updated on 18 May 2026. However, the analysis and financial metrics discussed here reflect the stock’s current position as of 21 June 2026, providing investors with the latest insights into the company’s fundamentals, valuation, financial trends, and technical outlook.
Read full news article Announcements
Announcement under Regulation 30 (LODR)-Analyst / Investor Meet - Intimation
23-Jun-2026 | Source : BSESchedule of Analyst / Institutional Investors Meet on June 29 2026 and June 30 2026
Update On Sale Of Equity Shares Of Subsidiary Company
22-Jun-2026 | Source : BSEEnclosed
Announcement under Regulation 30 (LODR)-Analyst / Investor Meet - Intimation
15-Jun-2026 | Source : BSEChange in the schedule of meeting on June 18 2026
Corporate Actions

No Upcoming Board Meetings

Foseco India Ltd. has declared 250% dividend, ex-date: 03 Jun 26

No Splits history available

No Bonus history available

No Rights history available
Quality key factors
Valuation key factors
Technicals key factors
 Technical Indicator Scale: Bearish, Mildly Bearish, Sideways, Mildly Bullish, Bullish Turned
 Shareholding Snapshot : Mar 2026
Shareholding Compare (%holding)
Promoters
None
Held by 2 Schemes (0.57%)
Held by 9 FIIs (0.08%)
Foseco Overseas Limited (49.15%)
Karibu Limited (9.73%)
9.29%
Quarterly Results Snapshot (Standalone) - Mar'26 - QoQ

QoQ Growth in quarter ended Mar 2026 is 10.28% vs -2.12% in Dec 2025
QoQ Growth in quarter ended Mar 2026 is 54.28% vs -5.82% in Dec 2025
Half Yearly Results Snapshot (Standalone) - Jun'25
Growth in half year ended Jun 2025 is 23.51% vs 6.76% in Jun 2024
Growth in half year ended Jun 2025 is 25.76% vs -18.02% in Jun 2024
Nine Monthly Results Snapshot (Standalone) - Sep'25
YoY Growth in nine months ended Sep 2025 is 17.56% vs 9.36% in Sep 2024
YoY Growth in nine months ended Sep 2025 is 11.61% vs -5.63% in Sep 2024
Annual Results Snapshot (Standalone) - Dec'25
YoY Growth in year ended Dec 2025 is 15.10% vs 9.92% in Dec 2024
YoY Growth in year ended Dec 2025 is 3.00% vs 0.07% in Dec 2024
About Foseco India Ltd.

Company Coordinates


