
Compare IDBI Bank with Similar Stocks
Dashboard
The Bank has a high Capital Adequacy Ratio of 20.79% signifying high buffers against its risk based assets
Healthy long term growth as Net profit has grown by an annual rate of 47.57%
Positive results in Mar 26
With ROA of 2, it has a Very Attractive valuation with a 1.4 Price to Book Value
Despite the size of the company, domestic mutual funds hold only 1.04% of the company
Total Returns (Price + Dividend) 
Latest dividend: 2.1 per share ex-dividend date: Jul-15-2025
Risk Adjusted Returns v/s
Returns Beta

News
IDBI Bank Ltd. Sees Robust Trading Activity with 6.98% Surge Amid Institutional Interest
IDBI Bank Ltd., a mid-cap player in the private sector banking industry, witnessed a significant uptick in trading activity on 22 June 2026, with its shares outperforming both the sector and broader market indices. The stock recorded a robust 6.98% gain in value, driven by high volume turnover and notable institutional participation, signalling renewed investor confidence after a brief period of decline.
Read full news article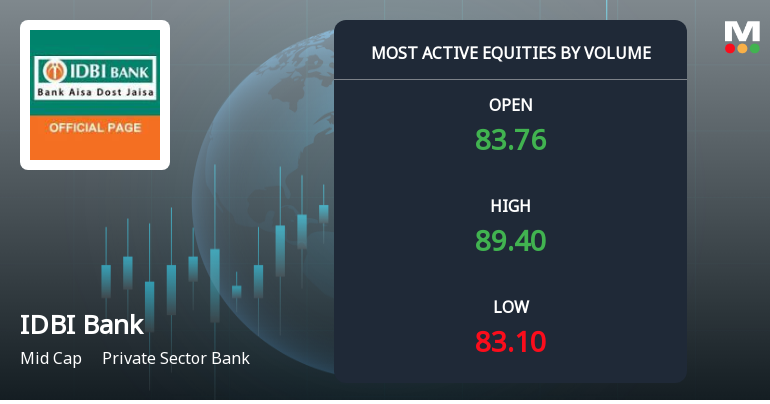
IDBI Bank Ltd. Sees Exceptional Volume Surge Amid Positive Price Momentum
IDBI Bank Ltd., a mid-cap player in the private sector banking industry, witnessed a remarkable surge in trading volume on 22 June 2026, accompanied by a strong price rally that outperformed its sector and the broader market indices. The stock’s robust activity signals renewed investor interest and potential accumulation, following a recent upgrade in its mojo grade from Sell to Hold.
Read full news article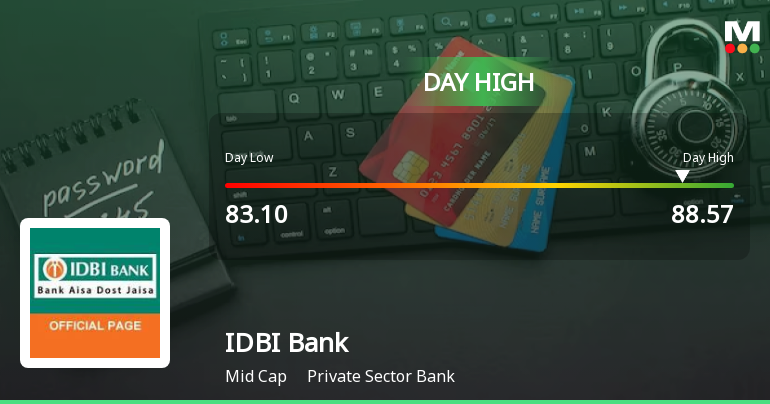
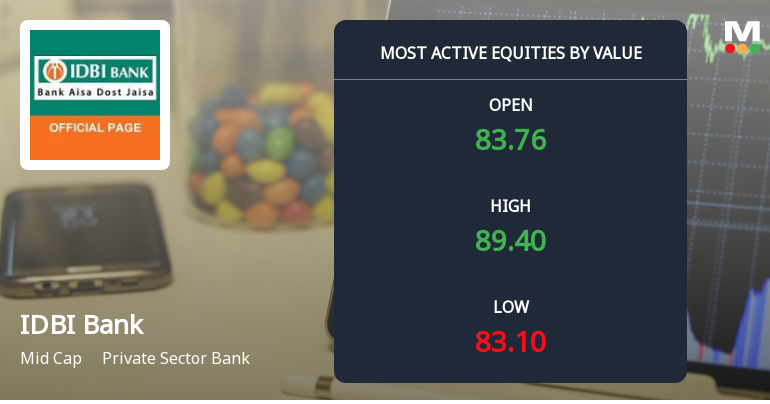
IDBI Bank Ltd. Surges 6.33% to Day's High of Rs 87.2 — Outperforms Sector by 4.78 Percentage Points
The Sensex advanced 0.47% on 22 Jun 2026, yet IDBI Bank Ltd. outpaced the broader market with a 6.33% gain, reaching an intraday high of Rs 87.2. This 4.78-percentage-point outperformance over its sector signals a distinctly stock-specific rally rather than a market-wide lift.
Read full news article Announcements
Board Meeting Intimation for Considering The Proposal For Early Redemption Of Three (3) Unsecured Redeemable Non-Convertible Senior Bonds.
23-Jun-2026 | Source : BSEIDBI Bank Ltdhas informed BSE that the meeting of the Board of Directors of the Company is scheduled on 30/06/2026 inter alia to consider and approve the proposal for early redemption of three (3) Unsecured Redeemable Non-Convertible Senior Bonds amounting to Rs. 5 crore issued during FY 2008-09 and FY 2009-10. Kindly acknowledge receipt and take the above on record
Reply To Clarification Sought From IDBI Bank Ltd
18-Jun-2026 | Source : BSEPlease find attached herewith Banks reply to the Clarification sought by the Exchange. Kindly Acknowledge receipt.
Clarification sought from IDBI Bank Ltd
18-Jun-2026 | Source : BSEThe Exchange has sought clarification from IDBI Bank Ltd on June 18 2026 with reference to Movement in Volume.
The reply is awaited.
Corporate Actions

No Upcoming Board Meetings

IDBI Bank Ltd. has declared 21% dividend, ex-date: 15 Jul 25

No Splits history available

No Bonus history available

No Rights history available
Quality key factors
Valuation key factors
Technicals key factors
 Technical Indicator Scale: Bearish, Mildly Bearish, Sideways, Mildly Bullish, Bullish Turned
 Shareholding Snapshot : Mar 2026
Shareholding Compare (%holding)
Promoters
None
Held by 20 Schemes (0.05%)
Held by 78 FIIs (0.56%)
Life Insurance Corporation Of India (49.24%)
None
3.82%
Quarterly Results Snapshot (Standalone) - Mar'26 - QoQ

QoQ Growth in quarter ended Mar 2026 is 10.25% vs -0.43% in Dec 2025
QoQ Growth in quarter ended Mar 2026 is 0.40% vs -46.64% in Dec 2025
Half Yearly Results Snapshot (Standalone) - Sep'25

Growth in half year ended Sep 2025 is 0.12% vs 9.41% in Sep 2024
Growth in half year ended Sep 2025 is 58.47% vs 39.58% in Sep 2024
Nine Monthly Results Snapshot (Standalone) - Dec'25
YoY Growth in nine months ended Dec 2025 is -3.31% vs 12.8% in Dec 2024
YoY Growth in nine months ended Dec 2025 is 38.55% vs 36.41% in Dec 2024
Annual Results Snapshot (Standalone) - Mar'26
YoY Growth in year ended Mar 2026 is 0.33% vs 9.37% in Mar 2025
YoY Growth in year ended Mar 2026 is 26.59% vs 33.39% in Mar 2025
About IDBI Bank Ltd.

Company Coordinates


