
Compare Kopran with Similar Stocks
Dashboard
Strong ability to service debt as the company has a low Debt to EBITDA ratio of 2.56 times
The company has declared positive results in Mar'2026 after 6 consecutive negative quarters
With ROCE of 6.2, it has a Attractive valuation with a 1.6 Enterprise value to Capital Employed
Stock DNA
Pharmaceuticals & Biotechnology
INR 986 Cr (Micro Cap)
37.00
34
1.54%
0.27
4.85%
1.77
Total Returns (Price + Dividend) 
Latest dividend: 3 per share ex-dividend date: Sep-04-2025
Risk Adjusted Returns v/s
Returns Beta

News
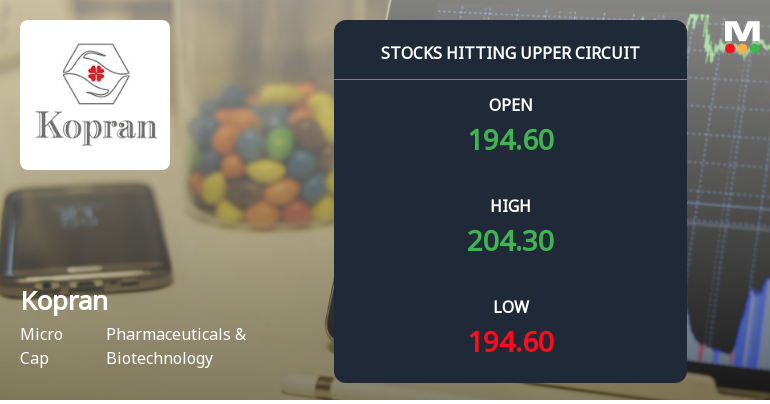
Kopran Ltd Locks at Upper Circuit With 5.0% Gain — Buyers Queue, Sellers Absent
At Rs 203.71, the buying was done — not because demand dried up, but because the exchange wouldn't let the stock go any higher. Kopran Ltd locked at its upper circuit of 5.0% on 22 Jun 2026, with buyers queuing and no sellers willing to part with shares.
Read full news article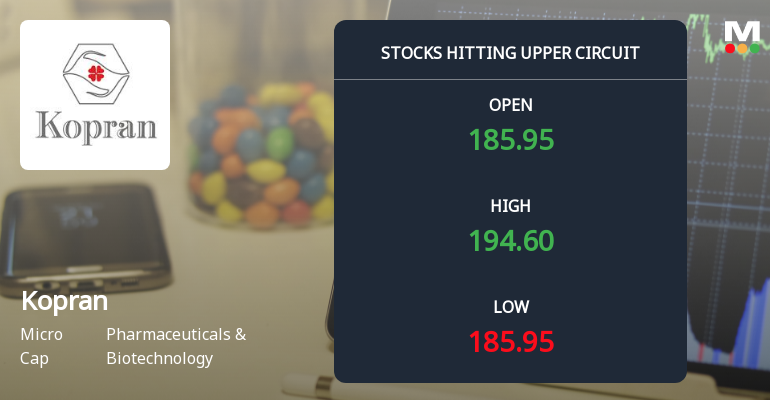
Kopran Ltd Locks at Upper Circuit With 5% Gain — Buyers Queue, Sellers Absent
At Rs 194, the buying was done — not because demand dried up, but because the exchange wouldn't let the stock go any higher. Kopran Ltd locked at its upper circuit of 5% on 19 Jun 2026, with buyers queuing and no sellers willing to part with shares.
Read full news article
Kopran Ltd is Rated Buy by MarketsMOJO
Kopran Ltd is rated 'Buy' by MarketsMOJO, with this rating last updated on 02 June 2026. However, the analysis and financial metrics discussed here reflect the stock's current position as of 14 June 2026, providing investors with the latest insights into the company’s performance and outlook.
Read full news article Announcements
Shareholder Meeting / Postal Ballot-Outcome of Court Convened Meeting
04-Jun-2026 | Source : BSEOutcome of NCLT convened meeting for equity shareholders secured creditor and unsecured creditor held on 03.06.2026
Compliances-Reg.24(A)-Annual Secretarial Compliance
22-May-2026 | Source : BSEAnnual Secretarial Compliance Report for the year ended March 31 2026
Announcement under Regulation 30 (LODR)-Newspaper Publication
21-May-2026 | Source : BSENewspaper Advertisement for the Q4 Results FY 2025-26
Corporate Actions

No Upcoming Board Meetings

Kopran Ltd has declared 30% dividend, ex-date: 04 Sep 25

No Splits history available

No Bonus history available

No Rights history available
Quality key factors
Valuation key factors
Technicals key factors
 Technical Indicator Scale: Bearish, Mildly Bearish, Sideways, Mildly Bullish, Bullish Turned
 Shareholding Snapshot : Mar 2026
Shareholding Compare (%holding)
Non Institution
None
Held by 5 Schemes (0.0%)
Held by 16 FIIs (0.57%)
Oricon Enterprises Limited (12.88%)
Madhuri Madhusudan Kela . (1.72%)
44.08%
Quarterly Results Snapshot (Consolidated) - Mar'26 - YoY

YoY Growth in quarter ended Mar 2026 is 35.77% vs -7.37% in Mar 2025
YoY Growth in quarter ended Mar 2026 is 94.94% vs -48.01% in Mar 2025
Half Yearly Results Snapshot (Consolidated) - Sep'25

Growth in half year ended Sep 2025 is -13.01% vs 7.94% in Sep 2024
Growth in half year ended Sep 2025 is -113.37% vs 11.73% in Sep 2024
Nine Monthly Results Snapshot (Consolidated) - Dec'25
YoY Growth in nine months ended Dec 2025 is -2.15% vs 6.70% in Dec 2024
YoY Growth in nine months ended Dec 2025 is -76.21% vs -10.67% in Dec 2024
Annual Results Snapshot (Consolidated) - Mar'26
YoY Growth in year ended Mar 2026 is 8.23% vs 2.44% in Mar 2025
YoY Growth in year ended Mar 2026 is -33.26% vs -24.35% in Mar 2025
About Kopran Ltd

Company Coordinates


