
Compare G K Consultants with Similar Stocks
Stock DNA
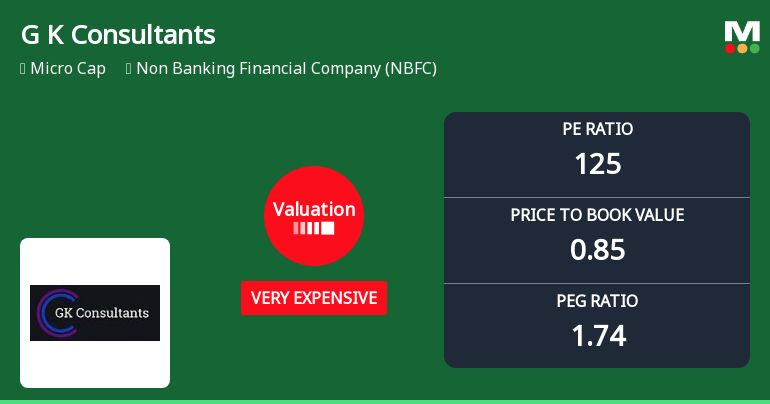
Non Banking Financial Company (NBFC)
INR 14 Cr (Micro Cap)
125.00
21
0.00%
0.00
0.68%
0.85
Total Returns (Price + Dividend) 
G K Consultants for the last several years.
Risk Adjusted Returns v/s
Returns Beta

News
G K Consultants Ltd Valuation Shifts Amidst Market Pressure
G K Consultants Ltd, a micro-cap player in the Non Banking Financial Company (NBFC) sector, has seen its valuation metrics deteriorate sharply, with its price-to-earnings (P/E) ratio surging to 125.36, signalling a transition from expensive to very expensive territory. This shift comes amid a significant decline in the stock price, which has fallen 7.3% in a single day and is down 23.58% over the past month, underperforming the Sensex by a wide margin.
Read full news article
G K Consultants Ltd Downgraded to Strong Sell Amid Weak Fundamentals and Bearish Technicals
G K Consultants Ltd, a micro-cap player in the Non Banking Financial Company (NBFC) sector, has seen its investment rating downgraded from Sell to Strong Sell as of 20 July 2026. This shift reflects deteriorating technical indicators, expensive valuation metrics, and stagnant financial trends, signalling heightened risks for investors amid a challenging market environment.
Read full news article
G K Consultants Ltd Valuation Shifts Amidst Market Volatility
G K Consultants Ltd, a micro-cap player in the Non Banking Financial Company (NBFC) sector, has experienced a notable shift in its valuation parameters, moving from a very expensive to an expensive rating. Despite a sharp decline in share price and a downgrade in its Mojo Grade from Strong Sell to Sell, the company’s valuation metrics reveal a complex picture of price attractiveness relative to peers and historical benchmarks.
Read full news article Announcements
Intimation Of Notice Of 38Th Annual General Meeting & Book Closure
31-Jul-2026 | Source : BSEIntimation of Notice of 38th Annual General Meeting and Book Closure
Intimation Of Notice Of 38Th Annual General Meeting & Book Closure
31-Jul-2026 | Source : BSEIntimation of Notice of 38th Annual general Meeting and Book Closure
Reg. 34 (1) Annual Report.
31-Jul-2026 | Source : BSEIntimation of Notice of 38th Annual General Meeting Annual Report for Financial Year 2025-26 & Book Closure
Corporate Actions

No Upcoming Board Meetings

No Dividend history available

No Splits history available

No Bonus history available

No Rights history available
Quality key factors
Valuation key factors
Technicals key factors
 Technical Indicator Scale: Bearish, Mildly Bearish, Sideways, Mildly Bullish, Bullish Turned
 Shareholding Snapshot : Jun 2026
Shareholding Compare (%holding)
Non Institution
None
Held by 0 Schemes
Held by 0 FIIs
Divya Malini Gupta (0.48%)
Ansh Gupta (10.46%)
91.83%
Quarterly Results Snapshot (Standalone) - Mar'26 - YoY

YoY Growth in quarter ended Mar 2026 is 23.81% vs -8.70% in Mar 2025

YoY Growth in quarter ended Mar 2026 is -1,450.00% vs 300.00% in Mar 2025
Half Yearly Results Snapshot (Standalone) - Sep'25
Growth in half year ended Sep 2025 is 104.17% vs -55.56% in Sep 2024
Growth in half year ended Sep 2025 is 555.56% vs -181.82% in Sep 2024
Nine Monthly Results Snapshot (Standalone) - Dec'25
YoY Growth in nine months ended Dec 2025 is 100.00% vs -42.65% in Dec 2024
YoY Growth in nine months ended Dec 2025 is 6,600.00% vs -107.14% in Dec 2024
Annual Results Snapshot (Standalone) - Mar'26
YoY Growth in year ended Mar 2026 is 71.67% vs -34.07% in Mar 2025
YoY Growth in year ended Mar 2026 is 233.33% vs -78.57% in Mar 2025
About G K Consultants Ltd

Company Coordinates


