
Compare India Homes with Similar Stocks
Dashboard
Weak Long Term Fundamental Strength with a -29.81% CAGR growth in Net Sales over the last 5 years
- Low ability to service debt as the company has a high Debt to EBITDA ratio of 4.52 times
- The company has been able to generate a Return on Equity (avg) of 8.29% signifying low profitability per unit of shareholders funds
With ROCE of 14.8, it has a Very Expensive valuation with a 7.3 Enterprise value to Capital Employed
Reducing Promoter Confidence
Stock DNA
Iron & Steel Products
INR 887 Cr (Micro Cap)
NA (Loss Making)
14
0.00%
2.01
41.44%
20.09
Total Returns (Price + Dividend) 
India Homes for the last several years.
Risk Adjusted Returns v/s
Returns Beta

News

India Homes Ltd Downgraded to Sell Amid Mixed Financials and Technical Signals
India Homes Ltd, a micro-cap player in the Iron & Steel Products sector, has seen its investment rating downgraded from Hold to Sell by MarketsMOJO as of 7 July 2026. This change reflects a complex interplay of deteriorating technical indicators, challenging valuation metrics, and weakening financial trends despite strong recent returns and quarterly performance.
Read full news article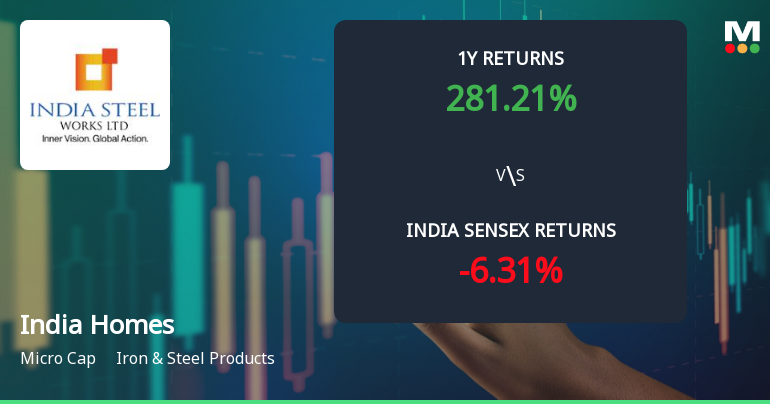
India Homes Ltd Technical Momentum Shifts Amid Mixed Indicator Signals
India Homes Ltd, a micro-cap player in the Iron & Steel Products sector, has experienced a subtle shift in its technical momentum, moving from a bullish to a mildly bullish stance. Despite a slight dip in the share price to ₹22.72, the stock’s technical indicators present a complex picture, with some signals pointing to caution while others suggest underlying strength. This article analyses the recent technical parameter changes, key momentum indicators, and the stock’s performance relative to broader market benchmarks.
Read full news article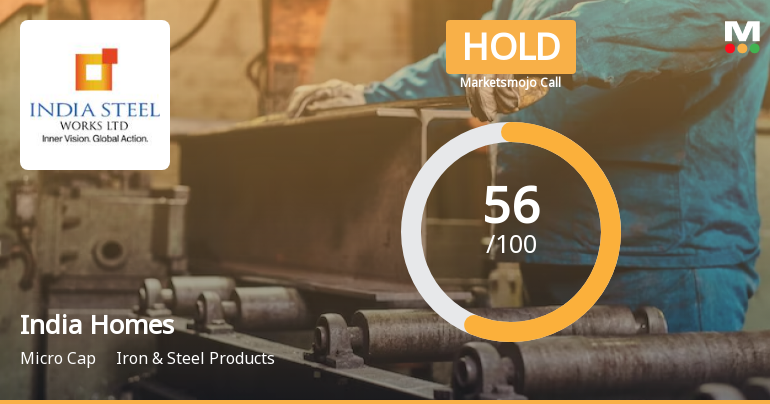
India Homes Ltd is Rated Hold by MarketsMOJO
India Homes Ltd is rated 'Hold' by MarketsMOJO, a rating that was established on 18 May 2026. While this rating was assigned on that date, the analysis and financial metrics discussed here reflect the company’s current position as of 03 July 2026, providing investors with an up-to-date perspective on the stock’s fundamentals, valuation, financial trends, and technical outlook.
Read full news article Announcements
Quarterly Disclosures By Listed Entities Of Defaults On Payment Of Interest/ Repayment Of Principal Amount On Loans From Banks / Financial Institutions And Unlisted Debt Securities
04-Jul-2026 | Source : BSEQuarterly Disclosures by listed entities of defaults on payment of interest/ repayment of principal amount on loans from banks / financial institutions and unlisted debt securities
Disclosures under Reg. 29(2) of SEBI (SAST) Regulations 2011
01-Jul-2026 | Source : BSEThe Exchange has received the disclosure under Regulation 29(2) of SEBI (Substantial Acquisition of Shares & Takeovers) Regulations 2011 for Isisales India Pvt Ltd
Disclosures under Reg. 29(2) of SEBI (SAST) Regulations 2011
30-Jun-2026 | Source : BSEThe Exchange has received the disclosure under Regulation 29(2) of SEBI (Substantial Acquisition of Shares & Takeovers) Regulations 2011 for Isisales India Pvt Ltd & Others
Corporate Actions

No Upcoming Board Meetings

No Dividend history available

No Splits history available

No Bonus history available

No Rights history available
Quality key factors
Valuation key factors
Technicals key factors
 Technical Indicator Scale: Bearish, Mildly Bearish, Sideways, Mildly Bullish, Bullish Turned
 Shareholding Snapshot : Mar 2026
Shareholding Compare (%holding)
Non Institution
0.5747
Held by 3 Schemes (0.0%)
Held by 0 FIIs
Yeotmal Land Development & Trading Co (p) Ltd (10.97%)
Metal Industrial Pte. Limited (17.75%)
25.86%
Quarterly Results Snapshot (Standalone) - Mar'26 - QoQ
QoQ Growth in quarter ended Mar 2026 is 0.00% vs 0.00% in Dec 2025

QoQ Growth in quarter ended Mar 2026 is 5,213.95% vs 113.65% in Dec 2025
Half Yearly Results Snapshot (Standalone) - Sep'25
Growth in half year ended Sep 2025 is 0.00% vs -100.00% in Sep 2024

Growth in half year ended Sep 2025 is 30.63% vs 41.99% in Sep 2024
Nine Monthly Results Snapshot (Standalone) - Dec'25
YoY Growth in nine months ended Dec 2025 is 0.00% vs -100.00% in Dec 2024
YoY Growth in nine months ended Dec 2025 is 58.47% vs 43.22% in Dec 2024
Annual Results Snapshot (Standalone) - Mar'26
YoY Growth in year ended Mar 2026 is 2,44,900.00% vs -98.78% in Mar 2025
YoY Growth in year ended Mar 2026 is 239.36% vs -15.23% in Mar 2025
About India Homes Ltd

Company Coordinates


