Salzer Electron.

  • Market Cap: Micro Cap
  • Industry: Other Electrical Equipment
  • ISIN: INE457F01013
  • NSEID: SALZERELEC
  • BSEID: 517059
INR
653.65
-7.35 (-1.11%)
BSENSE

Feb 13

BSE+NSE Vol: 1.35 lacs

  • Price Points
  • Score
  • Mojo Parameters
  • Total Return
  • News and Corporate Actions
  • Key factors
  • Shareholding
  • Financials
  • CompanyCV
stock-summaryPrice Point
High/Low

1Day

52 Week

Valuation
Technical
Day's Volume

CASH

1.35 lacs (-4.81%) Volume

Shareholding (Dec 2025)

FII

2.56%

Held by 5 FIIs

DII

0.00%

Held by 0 DIIs

Promoter

37.48%

Who are the top shareholders of the Salzer Electron.?

06-Jun-2025

The top shareholders of Salzer Electron include Quebec Information Services India Limited with 6.26%, individual investors at 47.77%, and Hmg Globetrotter as the highest public shareholder at 2.29%. There are currently no mutual funds holding shares in the company.

The top shareholders of Salzer Electron include Quebec Information Services India Limited, which holds the highest promoter stake at 6.26%. Additionally, individual investors collectively hold a significant portion at 47.77%. Among institutional investors, 12 foreign institutional investors (FIIs) hold a combined 2.58%. The highest public shareholder is Hmg Globetrotter, with a holding of 2.29%. It's worth noting that there are no mutual funds currently holding shares in the company.

View full answer

how big is Salzer Electron.?

06-Jun-2025

As of Jun 06, Salzer Electronics Ltd has a market capitalization of 1,648.65 Cr, with net sales of 1,418.32 Cr and a net profit of 66.35 Cr over the latest four quarters. Shareholder's funds are 473.46 Cr, and total assets are 993.20 Cr as of Mar'24.

Market Cap: Salzer Electronics Ltd has a market capitalization of 1,648.65 Cr and is classified as a Small Cap company as of Jun 06.<BR><BR>Recent Quarterly Performance: The sum of Net Sales for the latest 4 quarters, which is consolidated data, amounts to 1,418.32 Cr. The sum of Net Profit for the same period is 66.35 Cr.<BR><BR>Balance Sheet Snapshot: This is consolidated data for the latest annual period ending in Mar'24. Shareholder's Funds are reported at 473.46 Cr, while Total Assets stand at 993.20 Cr.

View full answer

What does Salzer Electron. do?

06-Jun-2025

Salzer Electronics Ltd is a small-cap company that manufactures electrical installation products and components, with net sales of ₹376 Cr and a net profit of ₹10 Cr for the quarter ending March 2025. The company has a market cap of ₹1,644 Cr and key metrics include a P/E ratio of 25.00 and a dividend yield of 0.27%.

Overview: <BR>Salzer Electronics Ltd is a small-cap company operating in the Other Electrical Equipment industry, specializing in the manufacture of electrical installation products and components.<BR><BR>History: <BR>Salzer Electronics Limited was incorporated on January 08, 1985. The latest quarterly results reported net sales and net profit for the period ending March 2025.<BR><BR>Financial Snapshot: <BR>Net Sales: 376 Cr (Quarterly Results - Mar 2025) <BR>Net Profit: 10 Cr (Quarterly Results - Mar 2025) <BR>Market Cap: Rs 1,644 Cr (Small Cap) <BR><BR>Key Metrics: <BR>P/E: 25.00 <BR>Industry P/E: 40 <BR>Dividend Yield: 0.27% <BR>Debt-Equity: 0.74 <BR>Return on Equity: 12.18% <BR>Price to Book: 3.02 <BR><BR>Contact Details: <BR>Address: Samichettipalayam (PO), Jothipuram (Via) Coimbatore Tamil Nadu : 641047 <BR>Tel: 91-0422-4233600/2692531 <BR>Email: salzer@salzergroup.com <BR>Website: http://www.salzergroup.net

View full answer

Has Salzer Electron. declared dividend?

06-Jun-2025

Salzer Electronics Ltd has declared a 25% dividend, amounting to ₹2.5 per share, with an ex-date of August 30, 2024. The company has shown strong long-term returns, with a total return of 1200.49% over the past 5 years, despite a recent decline of 29.63% in the last 6 months.

Salzer Electronics Ltd has declared a 25% dividend.<BR><BR>Dividend Details:<BR>- Percentage announced: 25%<BR>- Amount per share: 2.5<BR>- Ex-date: 30 Aug 24<BR><BR>Dividend Yield: 0.27%.<BR><BR>Total Returns by Period:<BR>In the last 6 months, the price return was -29.63%, with a dividend return of 0%, resulting in a total return of -29.63%.<BR><BR>Over the past year, the price return was 27.58%, the dividend return was 0.31%, leading to a total return of 27.89%.<BR><BR>In the 2-year period, the price return was 157.92%, with a dividend return of 1.30%, resulting in a total return of 159.22%.<BR><BR>For the 3-year period, the price return was 381.04%, the dividend return was 3.93%, culminating in a total return of 384.97%.<BR><BR>In the last 4 years, the price return was 521.58%, with a dividend return of 5.19%, achieving a total return of 526.77%.<BR><BR>Over the past 5 years, the price return was 1191.4%, the dividend return was 9.09%, resulting in a total return of 1200.49%.<BR><BR>Overall, Salzer Electronics Ltd has declared a significant dividend while showing varying total returns over different periods, with strong performance over the longer term despite a recent decline in the short term.

View full answer

Who are the peers of the Salzer Electron.?

03-Jun-2025

Salzer Electron.'s peers include Waaree Energies, Premier Energies, and Genus Power, among others. In terms of management risk, growth, and capital structure, Salzer Electron. shows average performance compared to its peers, with a 1-year return of 27.81%.

Peers: The peers of Salzer Electron. are Waaree Energies, Premier Energies, Apar Inds., Genus Power, Websol Energy, Rishabh Instrum., RMC Switchgears, Kirl. Electric, Solex Energy, and Australian Prem.<BR><BR>Quality Snapshot: Excellent management risk is observed at Premier Energies, while Good management risk is found at Waaree Energies and Apar Inds. Average management risk is present at Genus Power, Websol Energy, Salzer Electron., RMC Switchgears, and Solex Energy. Below Average management risk is noted at Rishabh Instrum., Kirl. Electric. Growth is Excellent for Premier Energies, Apar Inds., RMC Switchgears, and Solex Energy, while Good growth is seen at Websol Energy. Average growth is found at Salzer Electron., Genus Power, and the rest. Below Average growth is observed at Rishabh Instrum. and Kirl. Electric. Capital Structure is Excellent for Rishabh Instrum., Good for Waaree Energies, Apar Inds., and Genus Power, while Below Average is noted for Salzer Electron., RMC Switchgears, Solex Energy, and Kirl. Electric.<BR><BR>Return Snapshot: The peer with the highest 1-year return is Websol Energy at 136.44%, while Rishabh Instrum. has the lowest at -30.89%. Salzer Electron.'s 1-year return of 27.81% is significantly higher than Rishabh Instrum.'s but lower than Websol Energy's. Additionally, Rishabh Instrum., Kirl. Electric, and Solex Energy have negative six-month returns.

View full answer

Who are in the management team of Salzer Electron.?

16-Jul-2025

As of March 2023, the management team of Salzer Electron includes N Rangachary (Chairman), D Rajeshkumar (Managing Director), R Doraiswamy (Joint Managing Director & CFO), and several independent directors, totaling ten members who oversee the company's governance and management.

As of March 2023, the management team of Salzer Electron includes the following members:<BR><BR>1. N Rangachary - Chairman & Independent Director<BR>2. D Rajeshkumar - Managing Director<BR>3. R Doraiswamy - Joint Managing Director & CFO<BR>4. Rajeshkumar Thilagam - Non Executive Women Director<BR>5. N Jayabal - Independent Non Executive Director<BR>6. P Ramachandran - Whole-time Director<BR>7. Nirmal Kumar M Chandria - Independent Non Executive Director<BR>8. P K Shah - Independent Non Executive Director<BR>9. V Sankaran - Independent Non Executive Director<BR>10. Vishnu Rangaswamy - Independent Non Executive Director<BR><BR>This team comprises a mix of executive and independent directors, contributing to the governance and management of the company.

View full answer

Is Salzer Electron. overvalued or undervalued?

11-Nov-2025

As of November 10, 2025, Salzer Electronics is fairly valued with a PE ratio of 21.86 and a year-to-date return of -50.83%, significantly underperforming compared to its peers and the Sensex.

As of 10 November 2025, the valuation grade for Salzer Electronics has moved from attractive to fair. The company is currently fairly valued based on its financial metrics. Key ratios include a PE ratio of 21.86, an EV to EBITDA of 11.26, and a ROCE of 12.45%. <BR><BR>In comparison to its peers, Salzer Electronics has a lower PE ratio than Larsen & Toubro, which stands at 33.62, indicating that Salzer may not be as highly valued as some competitors. Other peers, such as CG Power & Industries and Siemens, are categorized as very expensive, with PE ratios of 108.77 and 56.89, respectively. The recent stock performance shows a significant decline, with a year-to-date return of -50.83%, contrasting sharply with the Sensex's positive return of 6.91% during the same period, reinforcing the notion that Salzer Electronics is currently fairly valued.

View full answer

How has been the historical performance of Salzer Electron.?

01-Dec-2025

Salzer Electron has shown consistent growth in net sales, increasing from INR 584.35 crore in March 2020 to INR 1,418.33 crore in March 2025, alongside rising profits, although it faces challenges with operational costs and fluctuating cash flow. Total assets and liabilities have also expanded proportionally during this period.

Answer:<BR>The historical performance of Salzer Electron shows a consistent upward trend in key financial metrics over the years.<BR><BR>Breakdown:<BR>Salzer Electron's net sales have increased significantly from INR 584.35 crore in March 2020 to INR 1,418.33 crore in March 2025, reflecting strong growth in total operating income, which mirrors the sales trend. The company's total expenditure, excluding depreciation, rose from INR 517.57 crore in March 2020 to INR 1,284.43 crore in March 2025, indicating rising operational costs. Operating profit (PBDIT) has also shown growth, climbing from INR 68.07 crore in March 2020 to INR 139.24 crore in March 2025, although the operating profit margin has slightly decreased from 11.43% in March 2020 to 9.44% in March 2025. Profit before tax has increased from INR 31.90 crore in March 2020 to INR 74.68 crore in March 2025, with profit after tax following a similar trajectory, rising from INR 27.41 crore to INR 52.49 crore in the same period. The company's total assets have expanded from INR 616.68 crore in March 2020 to INR 1,179.76 crore in March 2025, while total liabilities have also increased from INR 616.68 crore to INR 1,179.76 crore, indicating a proportional growth in debt. Cash flow from operating activities has fluctuated, with a negative cash flow of INR 11 crore in March 2025, contrasting with a positive cash flow of INR 20 crore in March 2024. Overall, Salzer Electron has demonstrated robust growth in sales and profits, although it faces challenges in managing operational costs and cash flow.

View full answer

Is Salzer Electron. technically bullish or bearish?

03-Dec-2025

As of December 2, 2025, the technical trend is mildly bearish, supported by bearish MACD and moving averages, while the KST and OBV show mixed signals, indicating a predominance of bearish indicators.

As of 2 December 2025, the technical trend has changed from bearish to mildly bearish. The current stance is mildly bearish, driven by several key indicators. The MACD is bearish on the weekly chart and mildly bearish on the monthly chart. The Bollinger Bands also indicate a mildly bearish trend on both weekly and monthly time frames. Moving averages are bearish on the daily time frame, while the KST shows a mildly bullish signal weekly but is mildly bearish monthly. Dow Theory reflects a mildly bearish stance weekly with no trend monthly. Despite the OBV being bullish on both weekly and monthly charts, the overall technical picture remains mildly bearish due to the predominance of bearish signals across multiple indicators.

View full answer

When is the next results date for Salzer Electronics Ltd?

29-Jan-2026

The next results date for Salzer Electronics Ltd is 11 February 2026.

The next results date for Salzer Electronics Ltd is scheduled for 11 February 2026.

View full answer

Are Salzer Electronics Ltd latest results good or bad?

12-Feb-2026

Salzer Electronics Ltd's latest results show a 21.70% increase in net sales to ₹418.92 crores, but a concerning 51.53% drop in net profit to ₹13.00 crores, indicating significant challenges in profitability and operational efficiency. This disconnect raises red flags for investors regarding the company's financial health.

Salzer Electronics Ltd's latest results indicate a challenging situation for the company. While it achieved a notable 21.70% year-on-year growth in net sales for Q3 FY26, reaching ₹418.92 crores, this growth is overshadowed by a significant decline in profitability. The consolidated net profit fell sharply by 51.53% year-on-year to ₹13.00 crores, and the profit after tax (PAT) margin plummeted from 7.92% to 3.24%.<BR><BR>This disconnect between revenue growth and profitability raises concerns about operational efficiency and cost management. The operating margin also decreased from 10.25% to 8.73%, further highlighting the company's struggles to convert sales into profit. Additionally, the decline in other income from ₹15.63 crores to just ₹0.34 crores has compounded the profitability issues.<BR><BR>Overall, the results suggest that while Salzer Electronics is expanding its revenue base, it faces significant challenges in maintaining profitability, which could be a red flag for investors. The combination of deteriorating margins, rising leverage, and minimal institutional interest indicates that the company is currently in a precarious financial position.

View full answer

Should I buy, sell or hold Salzer Electronics Ltd?

13-Feb-2026

Why is Salzer Electronics Ltd falling/rising?

13-Feb-2026

As of 13-Feb, Salzer Electronics Ltd's stock price is at 653.65, down 1.11% and has underperformed recently, with a total decline of 2.69% over the last two days. Despite mixed longer-term performance, investor interest is rising, indicated by a significant increase in delivery volume.

As of 13-Feb, Salzer Electronics Ltd's stock price is currently at 653.65, reflecting a decrease of 7.35 (-1.11%). The stock has been underperforming, having fallen for the last two consecutive days, resulting in a total decline of 2.69% during this period. Despite a recent intraday high of Rs 696, the stock's overall performance today has underperformed the sector by 0.26%.<BR><BR>In terms of longer-term performance, the stock has shown mixed results. Over the past week, it has increased by 6.80%, while it has gained 4.54% over the past month. However, year-to-date, it is down 4.61%, and over the past year, it has significantly declined by 31.58%. In contrast, the benchmark Sensex has risen by 8.52% over the same one-year period.<BR><BR>Investor participation appears to be increasing, with a notable rise in delivery volume of 84.39k on February 12, which is up 131.47% compared to the five-day average. This suggests that while the stock is currently experiencing a decline, there is growing interest among investors. The stock's liquidity remains adequate for trading, as it is based on 2% of the five-day average traded value.<BR><BR>Overall, the combination of recent price declines, underperformance against the sector, and significant year-over-year losses contribute to the current downward trend in Salzer Electronics Ltd's stock price.

View full answer
iScoreScore
Click here to find our call on this stock
Strong Sell
Sell
Hold
Buy
Strong Buy

Dashboard

1

Flat results in Dec 25

  • PAT(Latest six months) At Rs 25.39 cr has Grown at -39.27%
  • ROCE(HY) Lowest at 11.74%
  • DEBT-EQUITY RATIO(HY) Highest at 0.84 times
2

Despite the size of the company, domestic mutual funds hold only 0.03% of the company

3

Underperformed the market in the last 1 year

stock-summaryMojo Parameters

Mojo Parameters

Loading Valuation Snapshot...

Stock DNA

stock-summary
Industry

Other Electrical Equipment

stock-summary
Market cap

INR 1,197 Cr (Micro Cap)

stock-summary
P/E

22.00

stock-summary
Industry P/E

38

stock-summary
Dividend Yield

0.38%

stock-summary
Debt Equity

0.80

stock-summary
Return on Equity

9.72%

stock-summary
Price to Book

2.05

Revenue and Profits:
Net Sales:
424 Cr
(Quarterly Results - Dec 2025)
Net Profit:
12 Cr
stock-summaryTotal Returns
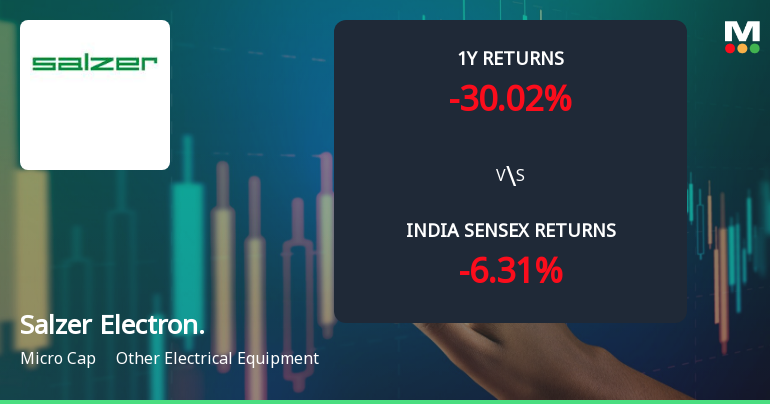
Total Returns (Price + Dividend) stock-summary
Dividend Yield (0.38%)
TimePeriod
Price Return
Dividend Return
Total Return
3 Months
-16.47%
0%
-16.47%
6 Months
-24.04%
0.29%
-23.75%
1 Year
-31.58%
0.27%
-31.31%
2 Years
29.17%
0.65%
29.82%
3 Years
129.96%
2.80%
132.76%
4 Years
223.35%
5.56%
228.91%
5 Years
439.32%
7.95%
447.27%

Latest dividend: 2.5 per share ex-dividend date: Aug-29-2025

Risk Adjusted Returns v/s stock-summary
Returns Beta
Icon
Beta has not been calculated since enough price history is not available
stock-summaryNews & Corporate Actions

News

Announcements stock-summary

Announcement under Regulation 30 (LODR)-Newspaper Publication

12-Feb-2026 | Source : BSE

Filing paper clippings of News papers in which the un-audited financial results for Q3FY26

Announcement under Regulation 30 (LODR)-Analyst / Investor Meet - Outcome

12-Feb-2026 | Source : BSE

Filing of link of Audio recording on Earning Call held on 12.02.2026 on Results of Q3FY26

Announcement under Regulation 30 (LODR)-Press Release / Media Release

11-Feb-2026 | Source : BSE

Intimation of Media Release on the results of Q3FY26

Corporate Actions stock-summary

stock-summary
BOARD MEETING

No Upcoming Board Meetings

stock-summary
DIVIDEND

Salzer Electronics Ltd has declared 25% dividend, ex-date: 29 Aug 25

stock-summary
SPLITS

No Splits history available

stock-summary
BONUS

No Bonus history available

stock-summary
RIGHTS

No Rights history available

stock-summaryKey Factors

Quality key factors stock-summary

Factor
Value
Sales Growth (5y)
23.88%
EBIT Growth (5y)
21.19%
EBIT to Interest (avg)
2.75
Debt to EBITDA (avg)
3.09
Net Debt to Equity (avg)
0.80
Sales to Capital Employed (avg)
1.43
Tax Ratio
27.40%
Dividend Payout Ratio
9.47%
Pledged Shares
17.20%
Institutional Holding
2.58%
ROCE (avg)
11.03%
ROE (avg)
9.40%

Valuation key factors

Factor
Value
P/E Ratio
22
Industry P/E
38
Price to Book Value
2.03
EV to EBIT
13.60
EV to EBITDA
11.11
EV to Capital Employed
1.57
EV to Sales
0.97
PEG Ratio
NA
Dividend Yield
0.38%
ROCE (Latest)
11.52%
ROE (Latest)
9.72%

Technicals key factors

Indicator
Weekly
Monthly
MACD
Bearish
Mildly Bearish
RSI
No Signal
No Signal
Bollinger Bands
Mildly Bearish
Mildly Bearish
Moving Averages
Mildly Bearish (Daily)
KST
Bearish
Mildly Bearish
Dow Theory
Mildly Bullish
Mildly Bearish
OBV
Mildly Bullish
Mildly Bearish
stock-summary Technical Indicator Scale: Bearish, Mildly Bearish, Sideways, Mildly Bullish, Bullish  Turned 
stock-summaryShareholding
Shareholding Snapshot : Dec 2025stock-summary
Shareholding Compare (%holding) stock-summary
Majority shareholders

Non Institution

Pledged Promoter Holdings

17.195

Mutual Funds

Held by 1 Schemes (0.02%)

FIIs

Held by 5 FIIs (2.56%)

Promoter with highest holding

Quebec Information Services India Limited (6.26%)

Highest Public shareholder

Hmg Globetrotter (2.47%)

Individual Investors Holdings

49.24%

stock-summaryFinancial
[
  {
    "link": "quarterly",
    "btn_text": "All Quarterly Results",
    "header": "Quarterly Results Snapshot (Consolidated) - Dec'25 - YoY",
    "rhs": [
      {
        "prefix": "Net Sales ",
        "suffix": "YoY Growth in quarter ended Dec 2025 is 24.23% vs 26.30% in Dec 2024",
        "dir": -1
      },
      {
        "prefix": "Consolidated Net Profit ",
        "suffix": "YoY Growth in quarter ended Dec 2025 is -17.34% vs 13.56% in Dec 2024",
        "dir": -1
      }
    ],
    "table": {
      "header": [
        "Dec'25",
        "Dec'24",
        "Change(%)"
      ],
      "body": [
        {
          "field": "Net Sales",
          "val1": "424.20",
          "val2": "341.46",
          "chgp": "24.23%",
          "chgp_class": "positive"
        },
        {
          "field": "Operating Profit (PBDIT) excl Other Income",
          "val1": "37.46",
          "val2": "35.99",
          "chgp": "4.08%",
          "chgp_class": "positive"
        },
        {
          "field": "Interest",
          "val1": "12.03",
          "val2": "10.56",
          "chgp": "13.92%",
          "chgp_class": "negative"
        },
        {
          "field": "Exceptional Items",
          "val1": "0.00",
          "val2": "0.00",
          "chgp": "",
          "chgp_class": "neutral"
        },
        {
          "field": "Consolidate Net Profit",
          "val1": "12.39",
          "val2": "14.99",
          "chgp": "-17.34%",
          "chgp_class": "negative"
        },
        {
          "field": "Operating Profit Margin (Excl OI)",
          "val1": "8.83%",
          "val2": "10.54%",
          "chgp": "-1.71%",
          "chgp_class": "negative"
        }
      ]
    }
  },
  {
    "link": "half-yearly",
    "btn_text": "All Half Yearly Results",
    "header": "Half Yearly Results Snapshot (Consolidated) - Sep'25",
    "rhs": [
      {
        "prefix": "Net Sales ",
        "suffix": " Growth in half year ended Sep 2025 is 22.66% vs 23.14% in Sep 2024",
        "dir": -1
      },
      {
        "prefix": "Consolidated Net Profit ",
        "suffix": " Growth in half year ended Sep 2025 is -26.44% vs 108.19% in Sep 2024",
        "dir": -1
      }
    ],
    "table": {
      "header": [
        "Sep'25",
        "Sep'24",
        "Change(%)"
      ],
      "body": [
        {
          "field": "Net Sales",
          "val1": "860.03",
          "val2": "701.14",
          "chgp": "22.66%",
          "chgp_class": "positive"
        },
        {
          "field": "Operating Profit (PBDIT) excl Other Income",
          "val1": "78.32",
          "val2": "68.76",
          "chgp": "13.90%",
          "chgp_class": "positive"
        },
        {
          "field": "Interest",
          "val1": "23.34",
          "val2": "19.90",
          "chgp": "17.29%",
          "chgp_class": "negative"
        },
        {
          "field": "Exceptional Items",
          "val1": "0.00",
          "val2": "0.00",
          "chgp": "",
          "chgp_class": "neutral"
        },
        {
          "field": "Consolidate Net Profit",
          "val1": "30.29",
          "val2": "41.18",
          "chgp": "-26.44%",
          "chgp_class": "negative"
        },
        {
          "field": "Operating Profit Margin (Excl OI)",
          "val1": "9.11%",
          "val2": "9.81%",
          "chgp": "-0.70%",
          "chgp_class": "negative"
        }
      ]
    }
  },
  {
    "link": "nine-monthly",
    "btn_text": "All Nine Monthly Results",
    "header": "Nine Monthly Results Snapshot (Consolidated) - Dec'25",
    "rhs": [
      {
        "prefix": "Net Sales ",
        "suffix": "YoY Growth in nine months ended Dec 2025 is 23.18% vs 24.16% in Dec 2024",
        "dir": -1
      },
      {
        "prefix": "Consolidated Net Profit ",
        "suffix": "YoY Growth in nine months ended Dec 2025 is -24.02% vs 70.32% in Dec 2024",
        "dir": -1
      }
    ],
    "table": {
      "header": [
        "Dec'25",
        "Dec'24",
        "Change(%)"
      ],
      "body": [
        {
          "field": "Net Sales",
          "val1": "1,284.23",
          "val2": "1,042.60",
          "chgp": "23.18%",
          "chgp_class": "positive"
        },
        {
          "field": "Operating Profit (PBDIT) excl Other Income",
          "val1": "115.78",
          "val2": "104.75",
          "chgp": "10.53%",
          "chgp_class": "positive"
        },
        {
          "field": "Interest",
          "val1": "35.37",
          "val2": "30.46",
          "chgp": "16.12%",
          "chgp_class": "negative"
        },
        {
          "field": "Exceptional Items",
          "val1": "0.00",
          "val2": "0.00",
          "chgp": "",
          "chgp_class": "neutral"
        },
        {
          "field": "Consolidate Net Profit",
          "val1": "42.68",
          "val2": "56.17",
          "chgp": "-24.02%",
          "chgp_class": "negative"
        },
        {
          "field": "Operating Profit Margin (Excl OI)",
          "val1": "9.02%",
          "val2": "10.05%",
          "chgp": "-1.03%",
          "chgp_class": "negative"
        }
      ]
    }
  },
  {
    "link": "annual",
    "btn_text": "All Annual Results",
    "header": "Annual Results Snapshot (Consolidated) - Mar'25",
    "rhs": [
      {
        "prefix": "Net Sales ",
        "suffix": "YoY Growth in year ended Mar 2025 is 21.61% vs 12.45% in Mar 2024",
        "dir": 1
      },
      {
        "prefix": "Consolidated Net Profit ",
        "suffix": "YoY Growth in year ended Mar 2025 is 10.81% vs 18.52% in Mar 2024",
        "dir": -1
      }
    ],
    "table": {
      "header": [
        "Mar'25",
        "Mar'24",
        "Change(%)"
      ],
      "body": [
        {
          "field": "Net Sales",
          "val1": "1,418.33",
          "val2": "1,166.31",
          "chgp": "21.61%",
          "chgp_class": "positive"
        },
        {
          "field": "Operating Profit (PBDIT) excl Other Income",
          "val1": "133.90",
          "val2": "116.97",
          "chgp": "14.47%",
          "chgp_class": "positive"
        },
        {
          "field": "Interest",
          "val1": "41.14",
          "val2": "34.09",
          "chgp": "20.68%",
          "chgp_class": "negative"
        },
        {
          "field": "Exceptional Items",
          "val1": "0.00",
          "val2": "0.00",
          "chgp": "",
          "chgp_class": "neutral"
        },
        {
          "field": "Consolidate Net Profit",
          "val1": "50.84",
          "val2": "45.88",
          "chgp": "10.81%",
          "chgp_class": "positive"
        },
        {
          "field": "Operating Profit Margin (Excl OI)",
          "val1": "9.44%",
          "val2": "10.03%",
          "chgp": "-0.59%",
          "chgp_class": "negative"
        }
      ]
    }
  }
]

Quarterly Results Snapshot (Consolidated) - Dec'25 - YoYstock-summary

Dec'25
Dec'24
Change(%)
Net Sales
424.20
341.46
24.23%
Operating Profit (PBDIT) excl Other Income
37.46
35.99
4.08%
Interest
12.03
10.56
13.92%
Exceptional Items
0.00
0.00
Consolidate Net Profit
12.39
14.99
-17.34%
Operating Profit Margin (Excl OI)
8.83%
10.54%
-1.71%
Values in Rs Cr.
Direction Arrows
Net Sales

YoY Growth in quarter ended Dec 2025 is 24.23% vs 26.30% in Dec 2024

Direction Arrows
Consolidated Net Profit

YoY Growth in quarter ended Dec 2025 is -17.34% vs 13.56% in Dec 2024

Half Yearly Results Snapshot (Consolidated) - Sep'25stock-summary

Sep'25
Sep'24
Change(%)
Net Sales
860.03
701.14
22.66%
Operating Profit (PBDIT) excl Other Income
78.32
68.76
13.90%
Interest
23.34
19.90
17.29%
Exceptional Items
0.00
0.00
Consolidate Net Profit
30.29
41.18
-26.44%
Operating Profit Margin (Excl OI)
9.11%
9.81%
-0.70%
Values in Rs Cr.
Direction Arrows
Net Sales

Growth in half year ended Sep 2025 is 22.66% vs 23.14% in Sep 2024

Direction Arrows
Consolidated Net Profit

Growth in half year ended Sep 2025 is -26.44% vs 108.19% in Sep 2024

Nine Monthly Results Snapshot (Consolidated) - Dec'25stock-summary

Dec'25
Dec'24
Change(%)
Net Sales
1,284.23
1,042.60
23.18%
Operating Profit (PBDIT) excl Other Income
115.78
104.75
10.53%
Interest
35.37
30.46
16.12%
Exceptional Items
0.00
0.00
Consolidate Net Profit
42.68
56.17
-24.02%
Operating Profit Margin (Excl OI)
9.02%
10.05%
-1.03%
Values in Rs Cr.
Direction Arrows
Net Sales

YoY Growth in nine months ended Dec 2025 is 23.18% vs 24.16% in Dec 2024

Direction Arrows
Consolidated Net Profit

YoY Growth in nine months ended Dec 2025 is -24.02% vs 70.32% in Dec 2024

Annual Results Snapshot (Consolidated) - Mar'25stock-summary

Mar'25
Mar'24
Change(%)
Net Sales
1,418.33
1,166.31
21.61%
Operating Profit (PBDIT) excl Other Income
133.90
116.97
14.47%
Interest
41.14
34.09
20.68%
Exceptional Items
0.00
0.00
Consolidate Net Profit
50.84
45.88
10.81%
Operating Profit Margin (Excl OI)
9.44%
10.03%
-0.59%
Values in Rs Cr.
Direction Arrows
Net Sales

YoY Growth in year ended Mar 2025 is 21.61% vs 12.45% in Mar 2024

Direction Arrows
Consolidated Net Profit

YoY Growth in year ended Mar 2025 is 10.81% vs 18.52% in Mar 2024

stock-summaryCompany CV
About Salzer Electronics Ltd stock-summary
stock-summary
Salzer Electronics Ltd
Micro Cap
Other Electrical Equipment
Salzer Electronics Limited was incorporated on January 08, 1985, for manufacture of Electrical Installation Products and Components viz., CAM Operated Rotary switches, Selector Switches, Wiring Ducts, Voltmeter Switches, copper wires and cables and allied products addressing customers in the electrical equipment, power, medical equipment, automotive as well as renewable and uninterrupted power system spaces, in a single and unified segment.
Company Coordinates stock-summary
Company Details
Samichettipalayam (PO), Jothipuram (Via) Coimbatore Tamil Nadu : 641047
stock-summary
Tel: 91-0422-4233600/2692531
stock-summary
salzer@salzergroup.com
Registrar Details
GNSA Investor Services (P) Ltd , G R Mansion, 11 Srinivasan Road, Pondy Bazaar T Nagar , Chennai