
Compare BEML Ltd with Similar Stocks
Stock DNA
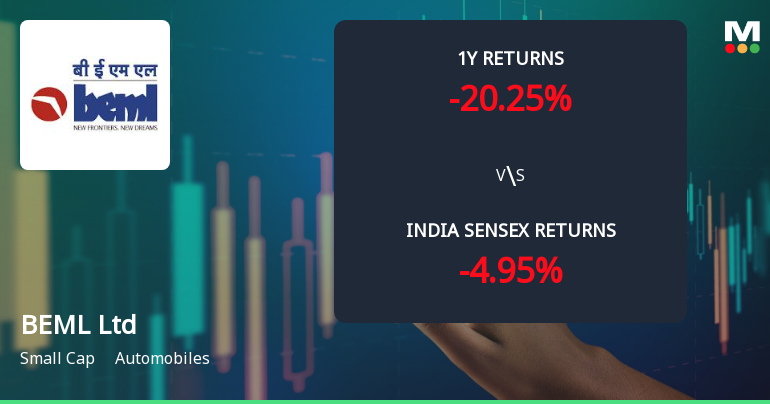
Automobiles
INR 14,626 Cr (Small Cap)
104.00
38
0.31%
0.09
4.82%
4.98
Total Returns (Price + Dividend) 
Latest dividend: 2.2992082616179004 per share ex-dividend date: Jun-05-2026
Risk Adjusted Returns v/s
Returns Beta

News
BEML Ltd Technical Momentum Shifts Amid Mixed Indicator Signals
BEML Ltd, a small-cap player in the automobile sector, has experienced a notable shift in its technical momentum, moving from a sideways trend to a mildly bearish stance. Despite some bullish signals on weekly charts, monthly indicators suggest caution, reflecting a complex interplay of market forces as the stock trades near ₹1,778.40, down 1.7% on the day.
Read full news article
BEML Ltd Technical Momentum Shifts Amid Mixed Market Signals
BEML Ltd, a key player in the Indian automobile sector, has experienced a notable shift in its technical momentum, moving from a mildly bearish stance to a sideways trend. Despite a modest day gain of 0.53%, the stock’s technical indicators present a complex picture, reflecting mixed signals across weekly and monthly timeframes. This analysis delves into the recent technical parameter changes, evaluating momentum oscillators, moving averages, and volume trends to provide a comprehensive view of BEML’s current market positioning.
Read full news article
BEML Ltd is Rated Sell by MarketsMOJO
BEML Ltd is rated 'Sell' by MarketsMOJO, with this rating last updated on 12 May 2026. However, the analysis and financial metrics discussed here reflect the stock's current position as of 15 June 2026, providing investors with an up-to-date view of the company's performance and outlook.
Read full news article Announcements
Announcement under Regulation 30 (LODR)-Analyst / Investor Meet - Outcome
16-Jun-2026 | Source : BSETranscript of Investors meet hosted by M/s Elara Capital on 10.06.2026
Announcement under Regulation 30 (LODR)-Analyst / Investor Meet - Outcome
10-Jun-2026 | Source : BSEPlease find below the link to the audio recording of the discussion held during the Investors / Analyst Meet hosted by Elara Capital on Wednesday the 10th June 2026 from 09:30 Hours at Mumbai.
Announcement under Regulation 30 (LODR)-Analyst / Investor Meet - Intimation
10-Jun-2026 | Source : BSEPresentation for the investor meet is enclosed herewith
Corporate Actions

No Upcoming Board Meetings

BEML Ltd has declared 46% dividend, ex-date: 05 Jun 26

BEML Ltd has announced 5:10 stock split, ex-date: 03 Nov 25

No Bonus history available

No Rights history available
Quality key factors
Valuation key factors
Technicals key factors
 Technical Indicator Scale: Bearish, Mildly Bearish, Sideways, Mildly Bullish, Bullish Turned
 Shareholding Snapshot : Mar 2026
Shareholding Compare (%holding)
Promoters
None
Held by 24 Schemes (17.55%)
Held by 112 FIIs (5.59%)
President Of India (54.03%)
Hdfc Mutual Fund - Hdfc Dividend Yield Fund (7.12%)
18.21%
Quarterly Results Snapshot (Consolidated) - Mar'26 - YoY

YoY Growth in quarter ended Mar 2026 is 8.57% vs 9.18% in Mar 2025
YoY Growth in quarter ended Mar 2026 is -37.47% vs 11.97% in Mar 2025
Half Yearly Results Snapshot (Consolidated) - Sep'25
Growth in half year ended Sep 2025 is -1.39% vs 0.01% in Sep 2024

Growth in half year ended Sep 2025 is 17.28% vs 16.28% in Sep 2024
Nine Monthly Results Snapshot (Consolidated) - Dec'25
YoY Growth in nine months ended Dec 2025 is 7.88% vs -6.73% in Dec 2024
YoY Growth in nine months ended Dec 2025 is -873.84% vs -80.10% in Dec 2024
Annual Results Snapshot (Consolidated) - Mar'26
YoY Growth in year ended Mar 2026 is 8.16% vs -0.79% in Mar 2025
YoY Growth in year ended Mar 2026 is -51.67% vs 3.82% in Mar 2025
About BEML Ltd

Company Coordinates


