
Compare Kovai Medical with Similar Stocks
Dashboard
High Management Efficiency with a high ROCE of 20.78%
Strong ability to service debt as the company has a low Debt to EBITDA ratio of 0.96 times
Flat results in Mar 26
With ROE of 20.5, it has a Very Attractive valuation with a 5.7 Price to Book Value
Majority shareholders : Promoters
Consistent Returns over the last 3 years
Total Returns (Price + Dividend) 
Latest dividend: 9.992974817422454 per share ex-dividend date: Aug-14-2025
Risk Adjusted Returns v/s
Returns Beta

News
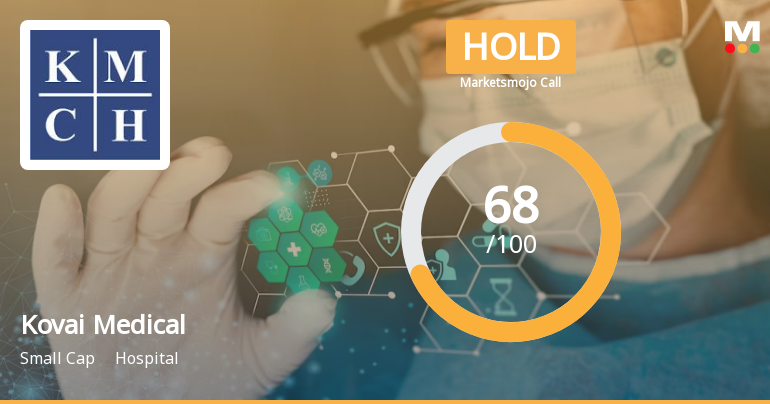
Kovai Medical Center & Hospital Ltd is Rated Hold
Kovai Medical Center & Hospital Ltd is rated 'Hold' by MarketsMOJO, with this rating last updated on 01 June 2026. However, all fundamentals, returns, and financial metrics discussed here reflect the stock's current position as of 24 June 2026, providing investors with an up-to-date analysis of its performance and outlook.
Read full news article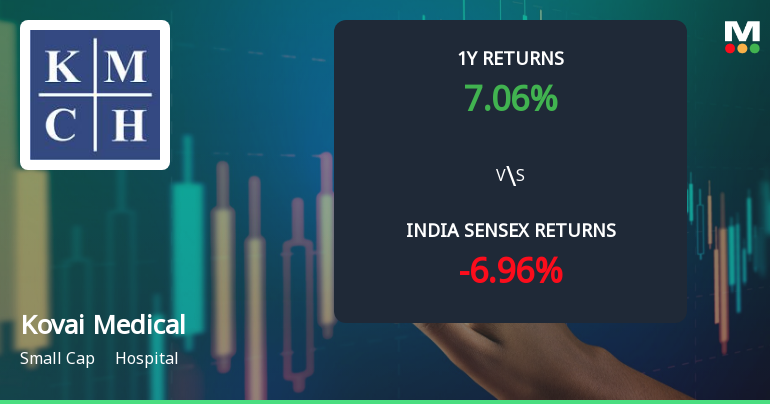
Kovai Medical Center & Hospital Ltd Sees Technical Momentum Shift Amid Strong Price Gains
Kovai Medical Center & Hospital Ltd has experienced a notable shift in its technical momentum, transitioning from a sideways trend to a mildly bullish stance. This change is underscored by a mix of bullish and mildly bearish signals across key technical indicators, reflecting a nuanced market sentiment for the small-cap hospital sector stock.
Read full news article
Kovai Medical Center & Hospital Ltd: Technical Momentum Shifts Amid Mixed Signals
Kovai Medical Center & Hospital Ltd has experienced a notable shift in its technical momentum, transitioning from a mildly bullish trend to a sideways pattern. Despite a modest day change of 0.10%, the stock’s technical indicators present a complex picture, with bullish signals on weekly MACD and Bollinger Bands contrasting with mildly bearish monthly trends and daily moving averages. This nuanced technical landscape warrants a detailed analysis for investors seeking clarity on the stock’s near-term trajectory.
Read full news article Announcements
Closure of Trading Window
20-Jun-2026 | Source : BSEThe Trading window for trading in Companys securities shall remain closed from 1st July2026 till the end of 48 hours after the declaration of Un-audited Financial Results for the Quarter ended 30th June2026 for insiders designated persons and their immediate relatives.
Announcement under Regulation 30 (LODR)-Newspaper Publication
12-Jun-2026 | Source : BSEWe enclose the copies of Newspaper Advertisement published in English and Tamil on 11th June2026 in the Trinity mirror and Makkal Kural respectively with regard to the Special window for Re-Lodgement of transfer requests of Physical shares.
Announcement under Regulation 30 (LODR)-Demise
07-Jun-2026 | Source : BSEIn compliance with Regulation 30 and Regulation 31A of the SEBI (Listing Obligations and Disclosure Requirements) Regulations 2015 we regret to inform you about the sad demise of Dr.Thavamani Devi Palaniswami (DIN : 00012135)Joint Managing Director of the company on 06.06.2026.
Corporate Actions

No Upcoming Board Meetings

Kovai Medical Center & Hospital Ltd has declared 100% dividend, ex-date: 14 Aug 25

No Splits history available

No Bonus history available

No Rights history available
Quality key factors
Valuation key factors
Technicals key factors
 Technical Indicator Scale: Bearish, Mildly Bearish, Sideways, Mildly Bullish, Bullish Turned
 Shareholding Snapshot : Mar 2026
Shareholding Compare (%holding)
Promoters
None
Held by 8 Schemes (3.12%)
Held by 47 FIIs (1.2%)
Kovai Purani Finance Private Limited (36.97%)
Dsp Healthcare Fund (1.63%)
22.62%
Quarterly Results Snapshot (Standalone) - Mar'26 - QoQ

QoQ Growth in quarter ended Mar 2026 is 1.62% vs 4.06% in Dec 2025
QoQ Growth in quarter ended Mar 2026 is -2.57% vs 10.47% in Dec 2025
Half Yearly Results Snapshot (Standalone) - Sep'25

Growth in half year ended Sep 2025 is 16.09% vs 14.17% in Sep 2024
Growth in half year ended Sep 2025 is 20.38% vs 29.52% in Sep 2024
Nine Monthly Results Snapshot (Standalone) - Dec'25
YoY Growth in nine months ended Dec 2025 is 15.58% vs 12.88% in Dec 2024
YoY Growth in nine months ended Dec 2025 is 17.42% vs 20.92% in Dec 2024
Annual Results Snapshot (Standalone) - Mar'26
YoY Growth in year ended Mar 2026 is 15.65% vs 12.43% in Mar 2025
YoY Growth in year ended Mar 2026 is 16.99% vs 16.26% in Mar 2025
About Kovai Medical Center & Hospital Ltd

Company Coordinates


