
Compare Kovai Medical with Similar Stocks
Dashboard
High Management Efficiency with a high ROCE of 20.78%
Strong ability to service debt as the company has a low Debt to EBITDA ratio of 0.96 times
Flat results in Mar 26
With ROE of 20.5, it has a Very Attractive valuation with a 5.5 Price to Book Value
Majority shareholders : Promoters
Total Returns (Price + Dividend) 
Latest dividend: 9.992974817422454 per share ex-dividend date: Aug-14-2025
Risk Adjusted Returns v/s
Returns Beta

News
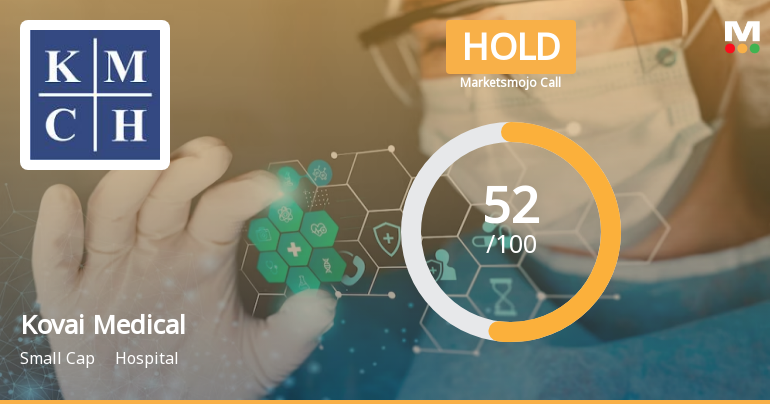
Kovai Medical Center & Hospital Ltd is Rated Hold
Kovai Medical Center & Hospital Ltd is rated 'Hold' by MarketsMOJO, with this rating last updated on 01 June 2026. However, the analysis and financial metrics discussed here reflect the stock's current position as of 16 July 2026, providing investors with an up-to-date view of the company’s fundamentals, valuation, financial trends, and technical outlook.
Read full news article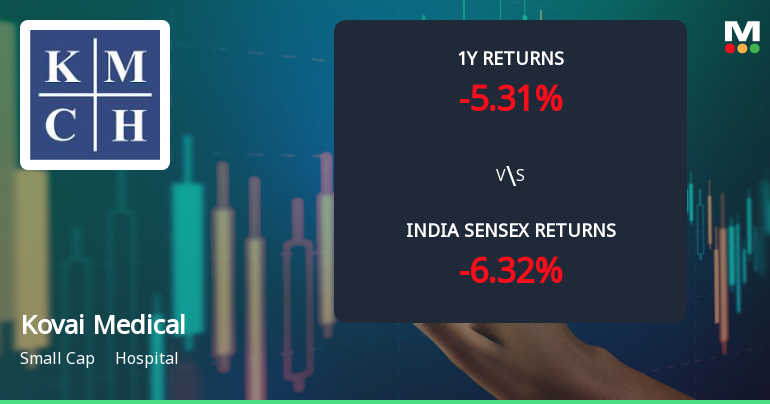
Kovai Medical Center & Hospital Ltd Sees Mixed Technical Signals Amid Mildly Bearish Momentum
Kovai Medical Center & Hospital Ltd has experienced a notable shift in its technical momentum, moving from a sideways trend to a mildly bearish stance. Despite this, key indicators such as the MACD and Bollinger Bands present a nuanced picture, reflecting a blend of bullish and bearish signals across weekly and monthly timeframes. This article delves into the technical parameters shaping the stock’s current trajectory, offering a comprehensive analysis for investors navigating the hospital sector’s small-cap landscape.
Read full news article
Kovai Medical Center & Hospital Ltd: Technical Momentum Shifts Amid Mixed Signals
Kovai Medical Center & Hospital Ltd has witnessed a notable shift in its technical momentum, moving from a mildly bearish stance to a more sideways trend. Despite a slight dip in the daily price, key technical indicators such as MACD and Bollinger Bands suggest emerging bullish signals on the weekly timeframe, while monthly charts remain cautiously mild bearish. This nuanced technical landscape offers investors a complex but insightful view into the stock’s near-term trajectory.
Read full news article Announcements
Compliances-Certificate under Reg. 74 (5) of SEBI (DP) Regulations 2018
09-Jul-2026 | Source : BSEWe attach herewith the certificate received from our RTA in compliance under 74(5) of SEBI(DP) Regulations2018 for the quarter ended 30.06.2026.
Board Meeting Intimation for Considering The Un-Audited Financial Results Of The Company For The Quarter Ended 30.06.2026.
07-Jul-2026 | Source : BSEKovai Medical Center & Hospital Ltdhas informed BSE that the meeting of the Board of Directors of the Company is scheduled on 07/08/2026 inter alia to consider and approve the Un-audited Financial results of the Company for the quarter ended 30.06.2026.
Announcement under Regulation 30 (LODR)-Newspaper Publication
30-Jun-2026 | Source : BSEWe enclose the copies of Newspaper Advertisement published in English and Tamil on 29.06.2026 with regard to the 40th Annual General meeting Notice to Shareholders.
Corporate Actions

07 Aug 2026

Kovai Medical Center & Hospital Ltd has declared 150% dividend, ex-date: 19 Aug 26

No Splits history available

No Bonus history available

No Rights history available
Quality key factors
Valuation key factors
Technicals key factors
 Technical Indicator Scale: Bearish, Mildly Bearish, Sideways, Mildly Bullish, Bullish Turned
 Shareholding Snapshot : Jun 2026
Shareholding Compare (%holding)
Promoters
None
Held by 9 Schemes (3.03%)
Held by 44 FIIs (1.25%)
Kovai Purani Finance Private Limited (36.97%)
Dsp Healthcare Fund (1.54%)
22.83%
Quarterly Results Snapshot (Standalone) - Mar'26 - QoQ

QoQ Growth in quarter ended Mar 2026 is 1.62% vs 4.06% in Dec 2025
QoQ Growth in quarter ended Mar 2026 is -2.57% vs 10.47% in Dec 2025
Half Yearly Results Snapshot (Standalone) - Sep'25

Growth in half year ended Sep 2025 is 16.09% vs 14.17% in Sep 2024
Growth in half year ended Sep 2025 is 20.38% vs 29.52% in Sep 2024
Nine Monthly Results Snapshot (Standalone) - Dec'25
YoY Growth in nine months ended Dec 2025 is 15.58% vs 12.88% in Dec 2024
YoY Growth in nine months ended Dec 2025 is 17.42% vs 20.92% in Dec 2024
Annual Results Snapshot (Standalone) - Mar'26
YoY Growth in year ended Mar 2026 is 15.65% vs 12.43% in Mar 2025
YoY Growth in year ended Mar 2026 is 16.99% vs 16.26% in Mar 2025
About Kovai Medical Center & Hospital Ltd

Company Coordinates


