
Compare Kirloskar Oil with Similar Stocks
Stock DNA
Compressors, Pumps & Diesel Engines
INR 34,757 Cr (Small Cap)
49.00
59
0.33%
1.05
16.43%
8.00
Total Returns (Price + Dividend) 
Latest dividend: 2.5086879432624114 per share ex-dividend date: Feb-20-2026
Risk Adjusted Returns v/s
Returns Beta

News
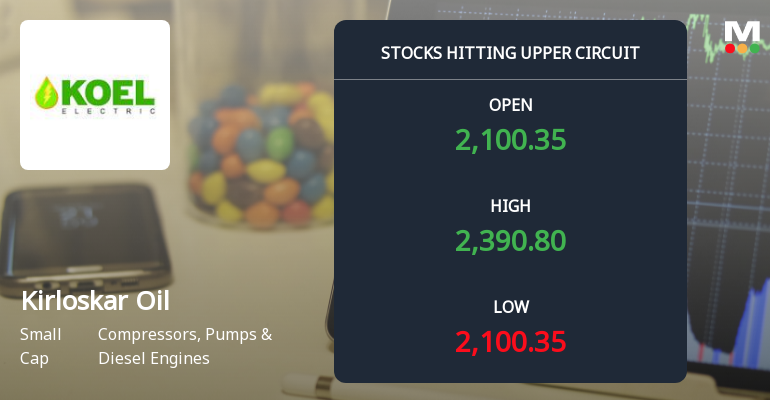
Kirloskar Oil Engines Ltd Locks at Upper Circuit With 20% Gain — Buyers Queue, Sellers Absent
At Rs 2,389.80, the buying was done — not because demand dried up, but because the exchange wouldn't let the stock go any higher. Kirloskar Oil Engines Ltd locked at its upper circuit of 20% on 22 Jun 2026, with buyers queuing and no sellers willing to part with shares.
Read full news article
Kirloskar Oil Engines Ltd Surges on High-Value Trading and Institutional Interest
Kirloskar Oil Engines Ltd (KIRLOSENG) has emerged as one of the most actively traded stocks by value on 22 June 2026, registering a remarkable 20.00% gain in a single day. The small-cap company, operating in the Compressors, Pumps & Diesel Engines sector, has attracted significant institutional interest and large order flow, driving its share price to new 52-week and all-time highs. This article analyses the trading activity, price performance, and underlying factors contributing to the stock’s robust momentum.
Read full news article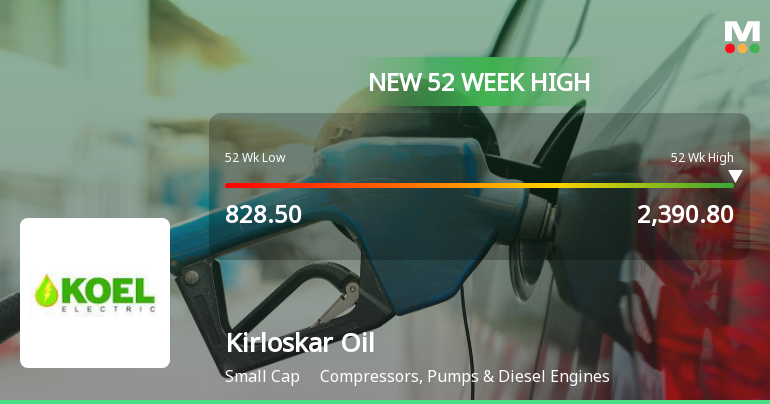
Broad-Based Technical Strength Lifts Kirloskar Oil Engines Ltd to 52-Week High of Rs 2390.8
Surging past its previous peaks, Kirloskar Oil Engines Ltd reached a new 52-week high of Rs 2390.8 on 22 Jun 2026, marking a remarkable 180.38% gain over the past year. This milestone reflects a powerful confluence of technical momentum and sustained price strength that has propelled the stock well ahead of the broader market’s modest gains.
Read full news article Announcements
Announcement under Regulation 30 (LODR)-Press Release / Media Release
19-Jun-2026 | Source : BSEPlease find enclosed herewith the press release. You are requested to take the same on your records.
Announcement under Regulation 30 (LODR)-Press Release / Media Release (Revised)
19-Jun-2026 | Source : BSEPlease find enclosed herewith the revised press release. You are requested to take the same on your records.
Announcement under Regulation 30 (LODR)-Newspaper Publication
12-Jun-2026 | Source : BSEPlease find attached herewith newspaper publication.
Corporate Actions

No Upcoming Board Meetings

Kirloskar Oil Engines Ltd has declared 125% dividend, ex-date: 20 Feb 26

No Splits history available

No Bonus history available

No Rights history available
Quality key factors
Valuation key factors
Technicals key factors
 Technical Indicator Scale: Bearish, Mildly Bearish, Sideways, Mildly Bullish, Bullish Turned
 Shareholding Snapshot : Mar 2026
Shareholding Compare (%holding)
Promoters
None
Held by 30 Schemes (24.87%)
Held by 161 FIIs (10.79%)
Rahul Chandrakant Kirloskar As Individual, As A Karta Of Rahul C. Kirloskar Huf And As A Trustee Of (12.24%)
Dsp Small Cap Fund (5.92%)
15.82%
Quarterly Results Snapshot (Consolidated) - Mar'26 - QoQ

QoQ Growth in quarter ended Mar 2026 is 13.01% vs -3.89% in Dec 2025
QoQ Growth in quarter ended Mar 2026 is 42.40% vs -31.44% in Dec 2025
Half Yearly Results Snapshot (Consolidated) - Sep'25
Growth in half year ended Sep 2025 is 18.38% vs 10.10% in Sep 2024

Growth in half year ended Sep 2025 is 6.11% vs 40.94% in Sep 2024
Nine Monthly Results Snapshot (Consolidated) - Dec'25
YoY Growth in nine months ended Dec 2025 is 21.68% vs 8.26% in Dec 2024
YoY Growth in nine months ended Dec 2025 is 16.09% vs 22.09% in Dec 2024
Annual Results Snapshot (Consolidated) - Mar'60
Not Applicable: The company has declared_date for only one period
Not Applicable: The company has declared_date for only one period
About Kirloskar Oil Engines Ltd

Company Coordinates


