
Compare Sical Logistics with Similar Stocks
Dashboard
High Debt company with Weak Long Term Fundamental Strength
- Poor long term growth as Net Sales has grown by an annual rate of -5.20% over the last 5 years
- High Debt Company with a Debt to Equity ratio (avg) of 8.05 times
- The company has reported losses. Due to this company has reported negative ROE
Flat results in Mar 26
With ROCE of 6.7, it has a Attractive valuation with a 2.2 Enterprise value to Capital Employed
56.75% of Promoter Shares are Pledged
Market Beating performance in long term as well as near term
Stock DNA
Transport Services
INR 812 Cr (Micro Cap)
NA (Loss Making)
63
0.00%
3.19
-6.75%
6.22
Total Returns (Price + Dividend) 
Sical Logistics for the last several years.
Risk Adjusted Returns v/s
Returns Beta

News

Sical Logistics Ltd Locks at Upper Circuit With 5% Gain — Buyers Queue, Sellers Absent
At Rs 107.01, the buying was done — not because demand dried up, but because the exchange wouldn't let the stock go any higher. Sical Logistics Ltd locked at its upper circuit of 5% on 28 Jul 2026, with buyers queuing and no sellers willing to part with shares.
Read full news article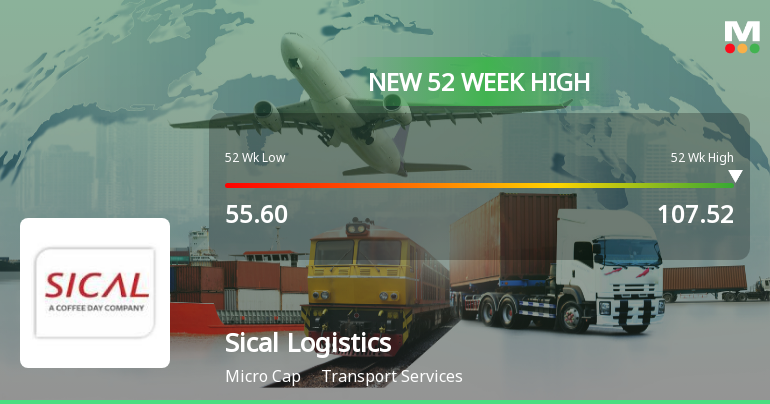
Broad-Based Technical Strength Lifts Sical Logistics Ltd to 52-Week High of Rs 107.52
Surging past its previous peaks, Sical Logistics Ltd touched a new 52-week high of Rs 107.52 on 28 Jul 2026, marking a significant milestone in its price momentum. This advance comes amid a backdrop of strong technical signals and sustained upward movement across multiple timeframes, underscoring the stock’s robust price action despite a broadly subdued market environment.
Read full news article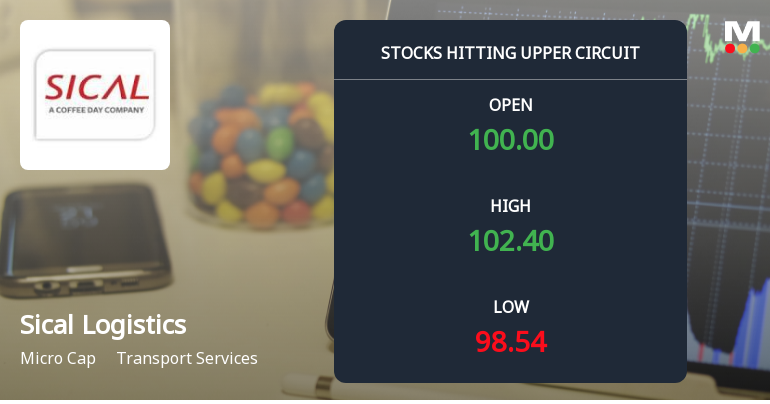
Sical Logistics Ltd Locks at Upper Circuit With 5% Gain — Buyers Queue, Sellers Absent
At Rs 101.92, the buying was done — not because demand dried up, but because the exchange wouldn't let the stock go any higher. Sical Logistics Ltd locked at its upper circuit of 5.0% on 27 Jul 2026, with buyers queuing and no sellers willing to part with shares.
Read full news article Announcements
Compliances-Certificate under Reg. 74 (5) of SEBI (DP) Regulations 2018
15-Jul-2026 | Source : BSESical Logistics Limited has informed the exchange regarding the certificate under Regulation 74(5) of Securities and Exchange Board of India (Depositories and Participants) Regulations 2018 for the quarter ended June 30 2026
Announcement under Regulation 30 (LODR)-Resignation of Chief Financial Officer (CFO)
09-Jul-2026 | Source : BSESical Logistics Limited has informed the exchange regarding the resignation of Mr. K. Rajavel from the post of chief financial officer of the company with effect from close of business hours of July 09 2026.
Announcement under Regulation 30 (LODR)-Resignation of Company Secretary / Compliance Officer
03-Jul-2026 | Source : BSESical Logistics Limited has informed the exchange regarding the resignation of Ms. Vaishali Jain from the post of company secretary and compliance officer of the Company with effect from close of business hours of July 03 2026.
Corporate Actions

No Upcoming Board Meetings

No Dividend history available

No Splits history available

No Bonus history available

Sical Logistics Ltd has announced 11:5 rights issue, ex-date: 18 Feb 26
Quality key factors
Valuation key factors
Technicals key factors
 Technical Indicator Scale: Bearish, Mildly Bearish, Sideways, Mildly Bullish, Bullish Turned
 Shareholding Snapshot : Jun 2026
Shareholding Compare (%holding)
Promoters
56.7462
Held by 5 Schemes (0.0%)
Held by 5 FIIs (3.09%)
Pristine Malwa Logistics Park Private Limited (73.5%)
Shaunak Jagdish Shah (4.72%)
17.95%
Quarterly Results Snapshot (Consolidated) - Mar'26 - QoQ

QoQ Growth in quarter ended Mar 2026 is 12.89% vs 3.73% in Dec 2025

QoQ Growth in quarter ended Mar 2026 is -120.71% vs 310.25% in Dec 2025
Half Yearly Results Snapshot (Consolidated) - Sep'25
Growth in half year ended Sep 2025 is 106.11% vs -30.87% in Sep 2024
Growth in half year ended Sep 2025 is 129.73% vs -11.12% in Sep 2024
Nine Monthly Results Snapshot (Consolidated) - Dec'25
YoY Growth in nine months ended Dec 2025 is 99.35% vs -20.44% in Dec 2024
YoY Growth in nine months ended Dec 2025 is 289.23% vs -162.10% in Dec 2024
Annual Results Snapshot (Consolidated) - Mar'26
YoY Growth in year ended Mar 2026 is 73.87% vs 0.33% in Mar 2025
YoY Growth in year ended Mar 2026 is 235.56% vs -34.93% in Mar 2025
About Sical Logistics Ltd

Company Coordinates


