
Compare Safari Inds. with Similar Stocks
Dashboard
Low Debt Company with Strong Long Term Fundamental Strength
- Healthy long term growth as Net Sales has grown by an annual rate of 44.23% and Operating profit at 57.42%
- Company has a Debt to Equity ratio (avg) of 0.02 times
- The company has been able to generate a Return on Equity (avg) of 18.19% signifying high profitability per unit of shareholders funds
Flat results in Mar 26
With ROE of 15.1, it has a Expensive valuation with a 7.1 Price to Book Value
High Institutional Holdings at 39.11%
Stock DNA
Diversified consumer products
INR 8,001 Cr (Small Cap)
47.00
35
0.21%
-0.15
15.05%
7.20
Total Returns (Price + Dividend) 
Latest dividend: 1.998127215570865 per share ex-dividend date: Nov-14-2025
Risk Adjusted Returns v/s
Returns Beta

News
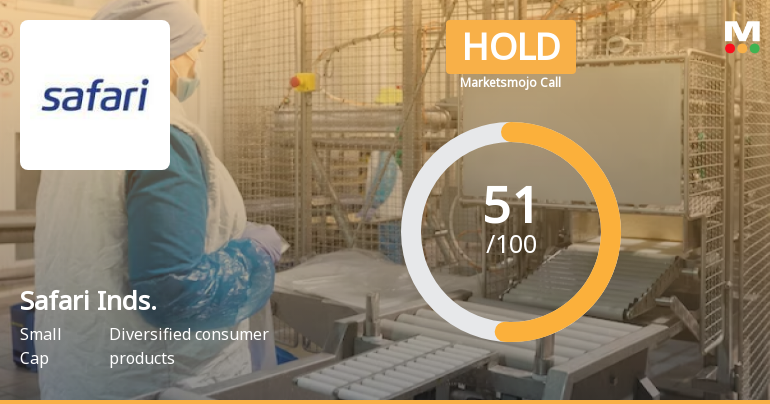
Safari Industries (India) Ltd is Rated Hold
Safari Industries (India) Ltd is rated 'Hold' by MarketsMOJO, with this rating last updated on 01 June 2026. However, the analysis and financial metrics discussed here reflect the stock's current position as of 05 July 2026, providing investors with the latest insights into the company’s performance and outlook.
Read full news article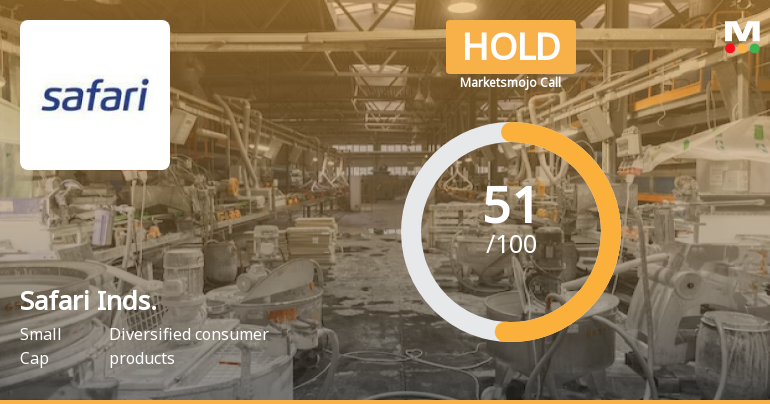
Safari Industries (India) Ltd is Rated Hold
Safari Industries (India) Ltd is rated 'Hold' by MarketsMOJO, with this rating last updated on 01 June 2026. However, the analysis and financial metrics discussed here reflect the stock's current position as of 24 June 2026, providing investors with an up-to-date view of the company’s fundamentals, valuation, financial trends, and technical outlook.
Read full news article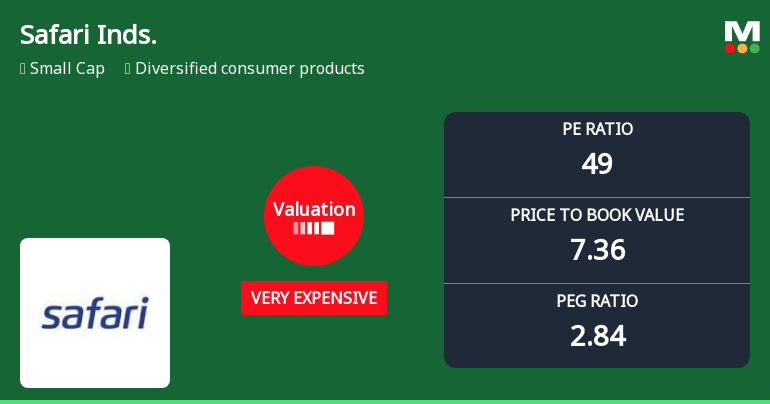
Safari Industries (India) Ltd Valuation Shifts Signal Heightened Price Premium
Safari Industries (India) Ltd has witnessed a notable shift in its valuation parameters, moving from an expensive to a very expensive rating, reflecting a significant change in price attractiveness. Despite a recent upgrade in its Mojo Grade from Sell to Hold, the stock’s elevated price-to-earnings (P/E) and price-to-book value (P/BV) ratios suggest investors should carefully weigh its premium valuation against historical and peer benchmarks.
Read full news article Announcements
Closure of Trading Window
30-Jun-2026 | Source : BSEPlease find enclosed herewith intimation for closure of Trading Window.
Intimation To Shareholders Whose Equity Shares Are Liable To Transfer To Investor Education And Protection Fund (IEPF)
09-Jun-2026 | Source : BSEIntimation To Shareholders Whose Equity Shares Are Liable To Transfer To Investor Education And Protection Fund (IEPF)
Announcement under Regulation 30 (LODR)-Newspaper Publication
02-Jun-2026 | Source : BSEDisclosure under Regulation 30 of SEBI (LODR) Regulations 2015 - Newspaper Publication
Corporate Actions

No Upcoming Board Meetings

Safari Industries (India) Ltd has declared 100% dividend, ex-date: 17 Jul 26

Safari Industries (India) Ltd has announced 2:10 stock split, ex-date: 22 Sep 17

Safari Industries (India) Ltd has announced 1:1 bonus issue, ex-date: 12 Dec 23

No Rights history available
Quality key factors
Valuation key factors
Technicals key factors
 Technical Indicator Scale: Bearish, Mildly Bearish, Sideways, Mildly Bullish, Bullish Turned
 Shareholding Snapshot : Mar 2026
Shareholding Compare (%holding)
Promoters
None
Held by 24 Schemes (20.64%)
Held by 107 FIIs (10.81%)
Sudhir Mohanlal Jatia (36.74%)
Hsbc Mutual Fund - Hsbc Small Cap Fund (4.91%)
9.25%
Quarterly Results Snapshot (Consolidated) - Mar'26 - QoQ

QoQ Growth in quarter ended Mar 2026 is -7.63% vs -3.97% in Dec 2025

QoQ Growth in quarter ended Mar 2026 is 13.93% vs -29.93% in Dec 2025
Half Yearly Results Snapshot (Consolidated) - Sep'25
Growth in half year ended Sep 2025 is 16.92% vs 13.95% in Sep 2024
Growth in half year ended Sep 2025 is 31.54% vs -17.42% in Sep 2024
Nine Monthly Results Snapshot (Consolidated) - Dec'25
YoY Growth in nine months ended Dec 2025 is 16.53% vs 13.97% in Dec 2024
YoY Growth in nine months ended Dec 2025 is 23.87% vs -20.67% in Dec 2024
Annual Results Snapshot (Consolidated) - Mar'26
YoY Growth in year ended Mar 2026 is 15.55% vs 14.26% in Mar 2025
YoY Growth in year ended Mar 2026 is 17.48% vs -18.78% in Mar 2025
About Safari Industries (India) Ltd

Company Coordinates


