
Compare Manaksia Alumi. with Similar Stocks
Dashboard
Healthy long term growth as Operating profit has grown by an annual rate 51.73%
Positive results in Mar 26
With ROCE of 9.8, it has a Very Attractive valuation with a 1.3 Enterprise value to Capital Employed
Majority shareholders : Promoters
Market Beating performance in long term as well as near term
Stock DNA
Non - Ferrous Metals
INR 247 Cr (Micro Cap)
32.00
14
0.19%
1.61
5.59%
1.80
Total Returns (Price + Dividend) 
Latest dividend: 0.07 per share ex-dividend date: Sep-08-2025
Risk Adjusted Returns v/s
Returns Beta

News

Manaksia Aluminium Company Ltd is Rated Buy
Manaksia Aluminium Company Ltd is rated 'Buy' by MarketsMOJO, with this rating last updated on 02 June 2026. However, the analysis and financial metrics presented here reflect the stock’s current position as of 25 June 2026, providing investors with the most up-to-date insight into the company’s performance and outlook.
Read full news article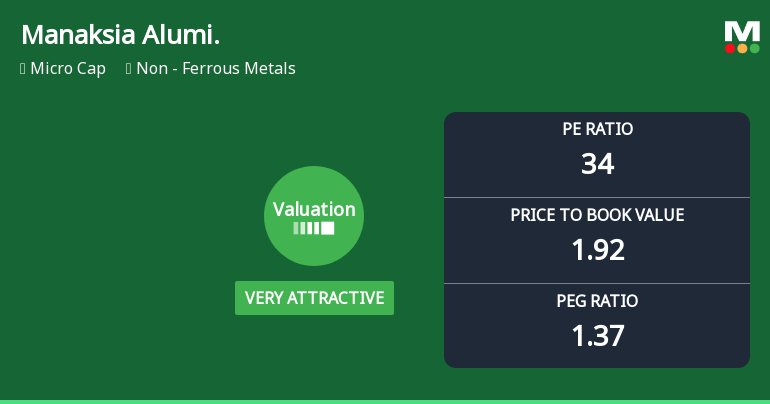
Manaksia Aluminium Company Ltd: Valuation Shifts Signal Renewed Price Attractiveness
Manaksia Aluminium Company Ltd has witnessed a significant shift in its valuation parameters, moving from an attractive to a very attractive rating. This change reflects a notable improvement in price-to-earnings (P/E) and price-to-book value (P/BV) ratios relative to its historical averages and peer group, signalling enhanced price attractiveness for investors amid a mixed market backdrop.
Read full news article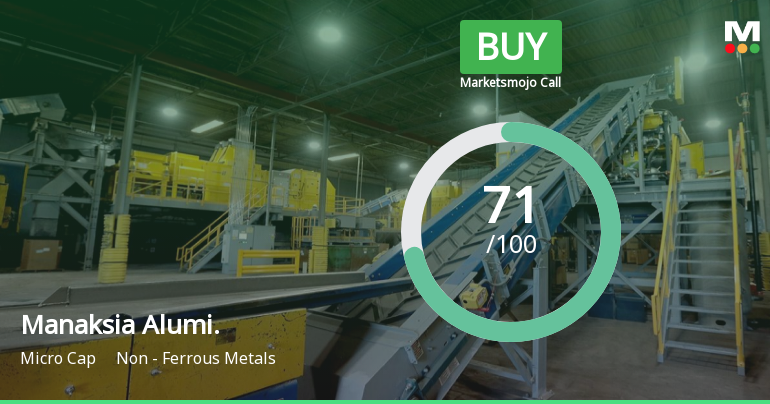
Manaksia Aluminium Company Ltd is Rated Buy
Manaksia Aluminium Company Ltd is rated 'Buy' by MarketsMOJO, with this rating last updated on 2 June 2026. However, the analysis and financial metrics discussed here reflect the stock's current position as of 14 June 2026, providing investors with the most up-to-date insight into the company’s performance and outlook.
Read full news article Announcements
Compliances-Reg.24(A)-Annual Secretarial Compliance
20-May-2026 | Source : BSEAnnual Secretarial Compliance Report for the FY 2025-26
Announcement under Regulation 30 (LODR)-Newspaper Publication
15-May-2026 | Source : BSENewspaper Publication for the opening of the Special Window for re-lodgement of transfer requests of physical shares.
Announcement under Regulation 30 (LODR)-Newspaper Publication
09-May-2026 | Source : BSENewspaper Publication of Financial Results of the Company for the quarter and year ended 31.03.2026
Corporate Actions

No Upcoming Board Meetings

Manaksia Aluminium Company Ltd has declared 7% dividend, ex-date: 08 Sep 25

No Splits history available

No Bonus history available

No Rights history available
Quality key factors
Valuation key factors
Technicals key factors
 Technical Indicator Scale: Bearish, Mildly Bearish, Sideways, Mildly Bullish, Bullish Turned
 Shareholding Snapshot : Mar 2026
Shareholding Compare (%holding)
Promoters
None
Held by 0 Schemes
Held by 1 FIIs (0.01%)
Sunil Kumar Agrawal (37.15%)
Monet Securities Pvt Ltd (3.37%)
16.48%
Quarterly Results Snapshot (Standalone) - Mar'26 - QoQ

QoQ Growth in quarter ended Mar 2026 is 9.14% vs 8.70% in Dec 2025
QoQ Growth in quarter ended Mar 2026 is 96.36% vs 48.65% in Dec 2025
Half Yearly Results Snapshot (Standalone) - Sep'25

Growth in half year ended Sep 2025 is 14.33% vs 21.56% in Sep 2024
Growth in half year ended Sep 2025 is 11.25% vs 5.26% in Sep 2024
Nine Monthly Results Snapshot (Standalone) - Dec'25
YoY Growth in nine months ended Dec 2025 is 9.72% vs 26.30% in Dec 2024
YoY Growth in nine months ended Dec 2025 is 6.67% vs 15.38% in Dec 2024
Annual Results Snapshot (Standalone) - Mar'26
YoY Growth in year ended Mar 2026 is 10.76% vs 17.73% in Mar 2025
YoY Growth in year ended Mar 2026 is 24.96% vs 18.86% in Mar 2025
About Manaksia Aluminium Company Ltd

Company Coordinates


