Caprihans India

  • Market Cap: Micro Cap
  • Industry: Plastic Products - Industrial
  • ISIN: INE479A01018
  • NSEID:
  • BSEID: 509486
INR
74.74
-1.33 (-1.75%)
BSENSE

Aug 07, 03:30 PM

BSE+NSE Vol: 1.17 k

  • Price Points
  • Score
  • Mojo Parameters
  • Total Return
  • News and Corporate Actions
  • Key factors
  • Shareholding
  • Financials
  • CompanyCV
stock-recommendationUpcoming Result: Caprihans India will declare its result soon on 10 Aug 2026
stock-summaryPrice Point
High/Low

1Day

52 Week

Valuation
Technical
Day's Volume

CASH

1.17 k (-41.46%) Volume

Shareholding (Jun 2026)

FII

0.00%

Held by 0 FIIs

DII

0.02%

Held by 0 DIIs

Promoter

55.99%

Why is Caprihans India Ltd falling/rising?

08-Aug-2026

As of 07-Aug, Caprihans India Ltd's stock price is at 74.74, down 1.75%, and has underperformed its sector. The stock has declined 17.32% year-to-date and 43.61% over the past year, indicating a bearish trend despite increased investor participation.

As of 07-Aug, Caprihans India Ltd's stock price is falling, currently at 74.74, which reflects a decrease of 1.33 or 1.75%. The stock has underperformed its sector by 2.28% today and has experienced a trend reversal, falling after two consecutive days of gains. Notably, the stock opened with a significant loss of 5.3%, reaching an intraday low of Rs 72.04. <BR><BR>In terms of performance relative to the benchmark, the stock has shown a year-to-date decline of 17.32%, which is substantially worse than the Sensex's decline of 7.89%. Over the past year, the stock has decreased by 43.61%, while the Sensex has only fallen by 2.63%. Additionally, over the last three years, Caprihans India Ltd has seen a dramatic decline of 62.85%, contrasting sharply with the 19.02% increase in the Sensex.<BR><BR>Despite a rise in investor participation, with delivery volume increasing by 74.43% against the five-day average, the overall market sentiment appears negative, contributing to the stock's decline. The moving averages indicate that while the stock is above the 100-day moving average, it remains below the shorter-term moving averages, suggesting a bearish trend in the near term.

View full answer

Which are the latest news on Caprihans India?

07-Aug-2026

When is the next results date for Caprihans India Ltd?

07-Aug-2026

The next results date for Caprihans India Ltd is 10 August 2026.

The next results date for Caprihans India Ltd is scheduled for 10 August 2026.

View full answer

What does Caprihans India do?

11-Jun-2026

Caprihans India Ltd is a micro-cap manufacturer of PVC films, established in 1946 and part of The Kalpataru Construction Group since 1983. As of March 2026, it reported net sales of ₹183 Cr and a net profit of ₹7 Cr.

Overview: <BR>Caprihans India Ltd is a leading manufacturer of PVC films, operating in the plastic products industry and categorized as a micro-cap company.<BR><BR>History: <BR>Incorporated in April 1946, Caprihans India Ltd went public in 1978. The company changed ownership in 1983 and became part of The Kalpataru Construction Group. The latest quarterly results reported net sales and profit for March 2026.<BR><BR>Financial Snapshot: <BR>Net Sales: 183 Cr (Quarterly Results - Mar 2026) <BR>Net Profit: 7 Cr (Quarterly Results - Mar 2026) <BR>Market Cap: INR 139 Cr (Micro Cap)<BR><BR>Key Metrics: <BR>P/E: N/A <BR>Industry P/E: 36 <BR>Dividend Yield: 0.00% <BR>Debt-Equity: 1.59 <BR>Return on Equity: -11.23% <BR>Price to Book: 0.35<BR><BR>Contact Details: <BR>Address: Block -D Shivsagar Estate, Dr Annie Besant Road Worli Mumbai Maharashtra : 400018 <BR>Tel: 24978660/24978661 <BR>Email: cil@caprihansindia.com <BR>Website: http://www.caprihansindia.com

View full answer

How big is Caprihans India?

11-Jun-2026

As of 10th June, Caprihans India Ltd has a market capitalization of 139.00 Cr and reported net sales of 715.04 Cr, with a net loss of 47.01 Cr in the latest four quarters. Shareholder's funds were 431.96 Cr and total assets were 1,253.81 Cr as of March 2025.

As of 10th June, Caprihans India Ltd has a market capitalization of 139.00 Cr, classifying it as a Micro Cap company.<BR><BR>In the latest four quarters, Caprihans India reported net sales of 715.04 Cr. However, it experienced a loss of 47.01 Cr in net profit during the same period.<BR><BR>The latest annual period for the balance sheet is March 2025, where shareholder's funds amounted to 431.96 Cr and total assets were reported at 1,253.81 Cr.

View full answer

Who are in the management team of Caprihans India?

11-Jun-2026

The management team of Caprihans India includes Robin Banerjee (Managing Director), Ankita J Kariya (Chairperson), and several independent and non-executive directors, overseeing the company's operations and strategic direction.

The management team of Caprihans India includes the following individuals:<BR><BR>1. **Robin Banerjee** - Managing Director<BR>2. **Ankita J Kariya** - Chairperson<BR>3. **Bhoumick S Vaidya** - Independent Director<BR>4. **Nitin K Joshi** - Independent Director<BR>5. **Siddharth S Shetye** - Independent Director<BR>6. **Narendra Shantilal Lodha** - Director<BR>7. **Chandrashekhar G Joglekar** - Director<BR>8. **Pritam Paul** - Company Secretary & Compliance Officer<BR>9. **Tanuj Kumar Lodha** - Additional Non-Executive Director & Independent Director<BR>10. **Sudhir Narsinha Pendse** - Additional Director<BR><BR>This team is responsible for overseeing the company's operations and strategic direction.

View full answer

Who are the peers of the Caprihans India?

11-Jun-2026

Caprihans India's peers include Candour Techtex, Ecoplast, B. D. Industries, and others, with varying management risks and growth rates. Caprihans India has a 1-year return of -39.81%, lower than its peers, with several also experiencing negative returns.

Peers: The peers of Caprihans India are Candour Techtex, Ecoplast, B. D. Industries, Hind.Adhesive, Captain Pipes, Texmo Pipes, Bright Brothers, National Plastic, and Rungta Irrigatn.<BR><BR>Quality Snapshot: Excellent management risk is observed at B. D. Industries and National Plastic, while Average management risk is found at Ecoplast, Hind.Adhesive, and Captain Pipes. Below Average management risk is noted for Candour Techtex, Caprihans India, Texmo Pipes, Bright Brothers, Rungta Irrigatn., and the rest. Growth is Excellent at Rungta Irrigatn., Good at Ecoplast, B. D. Industries, and Bright Brothers, Average at Captain Pipes and the rest, and Below Average at Candour Techtex, Hind.Adhesive, Caprihans India, Texmo Pipes, and the rest. Capital Structure is Excellent at G M Polyplast, Good at Ecoplast, B. D. Industries, and Texmo Pipes, Below Average at Candour Techtex, Hind.Adhesive, Captain Pipes, Caprihans India, Bright Brothers, National Plastic, Rungta Irrigatn., and the rest.<BR><BR>Return Snapshot: The peer with the highest 1-year return is B. D. Industries at N/A, while the peer with the lowest is Candour Techtex at -14.80%. Caprihans India's 1-year return is -39.81%, which is lower than Candour Techtex. Additionally, several peers including Candour Techtex, Ecoplast, Captain Pipes, Bright Brothers, National Plastic, and Rungta Irrigatn. have negative six-month returns.

View full answer

Should I buy, sell or hold Caprihans India Ltd?

28-May-2026

Are Caprihans India Ltd latest results good or bad?

26-May-2026

Caprihans India Ltd's latest results show a net profit of ₹7.04 crores in Q4 FY26, a significant improvement from a loss in the previous quarter, but this was largely due to exceptional income. The company faces ongoing operational challenges and high debt levels, indicating that its long-term financial health remains uncertain.

Caprihans India Ltd's latest results present a mixed picture. In Q4 FY26, the company reported a net profit of ₹7.04 crores, a significant improvement compared to a loss of ₹15.60 crores in the previous quarter (Q3 FY26). This marks a remarkable year-on-year profit growth of 211.50% compared to ₹2.26 crores in Q4 FY25. Additionally, the operating margin improved to 9.96%, the highest in eight quarters.<BR><BR>However, it's important to note that this profitability was heavily influenced by exceptional other income of ₹18.41 crores, which accounted for a substantial portion of the profit before tax. Without this non-operating income, the underlying business would have reported a loss of ₹11.45 crores, indicating ongoing operational challenges.<BR><BR>The company also faces significant financial strain, with a debt-to-EBITDA ratio of 21.62 times, suggesting it is severely overleveraged. This high level of debt, coupled with interest expenses that exceed operating profit, raises concerns about the sustainability of its financial health.<BR><BR>Overall, while there has been a positive sequential improvement in profitability, the underlying operational inefficiencies and high leverage indicate that the company's long-term outlook remains precarious. Investors should approach with caution, as the recent results may not signal a sustainable turnaround.

View full answer

How has been the historical performance of Caprihans India?

13-Nov-2025

Caprihans India experienced a decline in profitability from March 2024 to March 2025, reporting a net loss after tax of -62.18 crore despite an increase in net sales to 751.51 crore. Total liabilities and assets decreased, while cash flow from operations improved, indicating a challenging financial year.

Answer:<BR>The historical performance of Caprihans India shows a decline in profitability and overall financial health from March 2024 to March 2025.<BR><BR>Breakdown:<BR>In the fiscal year ending March 2025, Caprihans India reported net sales of 751.51 crore, an increase from 704.19 crore in the previous year. However, total expenditure also rose to 715.60 crore from 660.20 crore, leading to an operating profit (PBDIT) of 51.96 crore, down from 61.92 crore. The company experienced a loss before tax of 78.69 crore, worsening from a loss of 65.34 crore the prior year, resulting in a profit after tax of -62.18 crore compared to -51.62 crore in March 2024. The earnings per share (EPS) also declined to -42.53 from -39.31. On the balance sheet, total liabilities decreased to 1,253.81 crore from 1,417.11 crore, while total assets also fell to 1,253.81 crore from 1,417.11 crore. The cash flow from operating activities showed improvement, with a positive cash flow of 90.00 crore compared to -46.00 crore in the previous year, although the net cash outflow was -3.00 crore, down from a net inflow of 0.00 crore. Overall, the financial metrics indicate a challenging year for Caprihans India, with increasing costs and losses impacting profitability despite a rise in sales.

View full answer

Who are the top shareholders of the Caprihans India?

17-Jul-2025

The top shareholders of Caprihans India are primarily its promoters, with Bilcare Limited owning 54.75%. Individual investors hold 39.24%, and the highest public shareholder is Rajesh Omkarnath Malpani at 3.4%, while there are no foreign institutional investors.

The top shareholders of Caprihans India are primarily its promoters, with Bilcare Limited holding the largest stake at 54.75%. There are no pledged promoter holdings, and individual investors collectively own 39.24% of the shares. The highest public shareholder is Rajesh Omkarnath Malpani, who holds 3.4%. Additionally, there are two mutual fund schemes with a minimal holding of 0.01%, and no foreign institutional investors (FIIs) are currently holding shares in the company.

View full answer

Is Caprihans India overvalued or undervalued?

09-Jun-2025

As of November 12, 2024, Caprihans India is considered overvalued with a negative PE ratio of -3.50 and an EV to EBITDA of 25.50, significantly underperforming its peers and the Sensex, leading to a risky valuation grade.

As of 12 November 2024, Caprihans India has moved from an attractive to a risky valuation grade. The company is currently considered overvalued based on its financial ratios. Key ratios include a PE Ratio of -3.50, an EV to EBITDA of 25.50, and a Price to Book Value of 0.44, which indicate significant concerns regarding profitability and valuation relative to its assets.<BR><BR>In comparison to its peers, Caprihans India stands out with a notably negative PE ratio, while competitors like Supreme Industries and Astral exhibit very high PE ratios of 57.34 and 78.35, respectively. This stark contrast highlights the challenges Caprihans faces in maintaining investor confidence. Additionally, the company's recent stock performance has underperformed the Sensex, with a year-to-date return of -16.09% compared to the Sensex's 5.61%, reinforcing the notion of its overvaluation in the current market environment.

View full answer

What is the technical trend for Caprihans India?

09-Jun-2025

As of June 6, 2025, Caprihans India shows a mildly bearish trend overall, with mixed signals from MACD and KST, while daily moving averages and Bollinger Bands reinforce the cautious outlook.

As of 6 June 2025, the technical trend for Caprihans India has changed from bearish to mildly bearish. The weekly MACD indicates a mildly bullish stance, while the monthly MACD remains bearish, suggesting mixed signals across time frames. The Bollinger Bands are mildly bearish on both weekly and monthly charts, reinforcing the bearish sentiment. Daily moving averages are bearish, which adds to the overall cautious outlook. The KST shows a mildly bullish signal on the weekly chart but is bearish monthly, indicating potential short-term strength that is not supported by longer-term indicators. The Dow Theory reflects a mildly bullish trend weekly but no trend monthly, further complicating the outlook. Overall, the current stance is mildly bearish, driven primarily by the bearish moving averages and mixed signals from MACD and KST.

View full answer

Has Caprihans India declared dividend?

06-Jun-2025

Caprihans India Ltd has declared a 7% dividend, amounting to 0.7 per share, with an ex-date of September 12, 2019. However, the current dividend yield is 0%, indicating no recent dividends, and total returns have varied across different periods, showing strong long-term performance despite the lack of dividends.

Caprihans India Ltd has declared a 7% dividend.<BR><BR>Dividend Details:<BR>- Percentage announced: 7%<BR>- Amount per share: 0.7<BR>- Ex-date: 12 Sep 19<BR><BR>Dividend Yield: 0%<BR><BR>Total Returns by Period:<BR>Over the 6-month period, the price return was -15.61%, with a dividend return of 0%, resulting in a total return of -15.61%.<BR><BR>In the 1-year period, the price return was -15.04%, the dividend return remained at 0%, leading to a total return of -15.04%.<BR><BR>For the 2-year period, the price return was -8.18%, with no dividend return, resulting in a total return of -8.18%.<BR><BR>During the 3-year period, the price return was 10.74%, the dividend return was 0%, yielding a total return of 10.74%.<BR><BR>In the 4-year period, the price return was 16.16%, with a dividend return of 0%, resulting in a total return of 16.16%.<BR><BR>Over the 5-year period, the price return was an impressive 233.75%, while the dividend return was 0%, culminating in a total return of 233.75%.<BR><BR>Overall, while Caprihans India Ltd did declare a dividend in the past, the current dividend yield is 0%, indicating no recent dividends have been issued. The total returns over various periods show a mix of negative and positive performance, particularly strong over the long term despite the absence of dividends in recent years.

View full answer
iScoreScore
Click here to find our call on this stock
Strong Sell
Sell
Hold
Buy
Strong Buy

Dashboard

1

Weak Long Term Fundamental Strength with an average Return on Capital Employed (ROCE) of 0%

  • Poor long term growth as Operating profit has grown by an annual rate -177.85% of over the last 5 years
  • Low ability to service debt as the company has a high Debt to EBITDA ratio of 16.28 times
2

Risky - Negative Operating Profits

3

Consistent Underperformance against the benchmark over the last 3 years

stock-summaryMojo Parameters

Mojo Parameters

Loading Valuation Snapshot...

Stock DNA

stock-summary
Industry

Plastic Products - Industrial

stock-summary
Market cap

INR 134 Cr (Micro Cap)

stock-summary
P/E

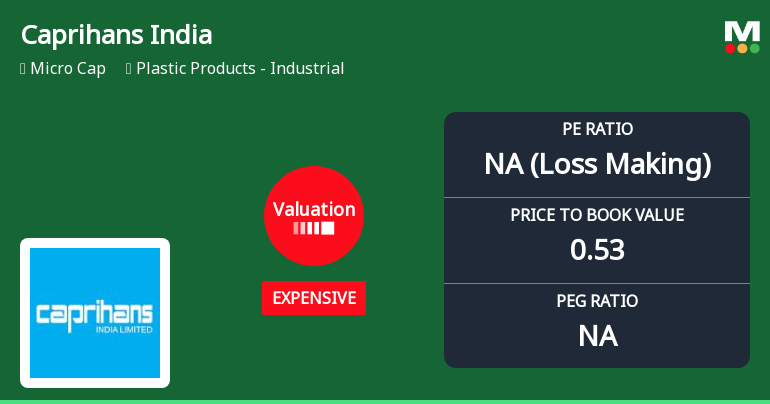
NA (Loss Making)

stock-summary
Industry P/E

34

stock-summary
Dividend Yield

0.00%

stock-summary
Debt Equity

1.59

stock-summary
Return on Equity

-11.23%

stock-summary
Price to Book

0.33

Revenue and Profits:
Net Sales:
183 Cr
(Quarterly Results - Mar 2026)
Net Profit:
7 Cr
stock-summaryTotal Returns
Total Returns (Price + Dividend) stock-summary
Dividend Yield (0%)
TimePeriod
Price Return
Dividend Return
Total Return
3 Months
-3.52%
0%
-3.52%
6 Months
-13.24%
0%
-13.24%
1 Year
-43.61%
0%
-43.61%
2 Years
-47.79%
0%
-47.79%
3 Years
-62.85%
0%
-62.85%
4 Years
-46.67%
0%
-46.67%
5 Years
-55.74%
0%
-55.74%

Latest dividend: 0.7 per share ex-dividend date: Sep-12-2019

Risk Adjusted Returns v/s stock-summary
Returns Beta
Icon
Beta has not been calculated since enough price history is not available
stock-summaryNews & Corporate Actions

Announcements stock-summary

Board Meeting Intimation for Considering Standalone & Consolidated Unaudited Financial Results For The Quarter Ended On 30 June 2026

06-Aug-2026 | Source : BSE

Caprihans India Ltd-has informed BSE that the meeting of the Board of Directors of the Company is scheduled on 10/08/2026 inter alia to consider and approve Unaudited Financial Results (Standalone & Consolidated) for the quarter ended on 30 June 2026

Compliances-Certificate under Reg. 74 (5) of SEBI (DP) Regulations 2018

13-Jul-2026 | Source : BSE

Caprihans India Limited has submitted certification under Regulation 74(5) of SEBI (DP) Regulations 2018.

Closure of Trading Window

25-Jun-2026 | Source : BSE

Caprihans India Limited has submitted Intimation towards closure of trading window

Corporate Actions stock-summary

stock-summary
BOARD MEETING

10 Aug 2026

stock-summary
DIVIDEND

Caprihans India Ltd has declared 7% dividend, ex-date: 12 Sep 19

stock-summary
SPLITS

No Splits history available

stock-summary
BONUS

No Bonus history available

stock-summary
RIGHTS

No Rights history available

stock-summaryKey Factors

Quality key factors stock-summary

Factor
Value
Sales Growth (5y)
19.09%
EBIT Growth (5y)
-177.85%
EBIT to Interest (avg)
-0.07
Debt to EBITDA (avg)
20.92
Net Debt to Equity (avg)
1.59
Sales to Capital Employed (avg)
0.93
Tax Ratio
8.65%
Dividend Payout Ratio
0
Pledged Shares
0
Institutional Holding
0.02%
ROCE (avg)
2.99%
ROE (avg)
0

Valuation key factors

Factor
Value
P/E Ratio
NA (Loss Making)
Industry P/E
34
Price to Book Value
0.32
EV to EBIT
-180.99
EV to EBITDA
18.97
EV to Capital Employed
0.74
EV to Sales
1.08
PEG Ratio
NA
Dividend Yield
NA
ROCE (Latest)
-0.41%
ROE (Latest)
-11.23%

Technicals key factors

Indicator
Weekly
Monthly
MACD
Mildly Bullish
Bearish
RSI
No Signal
No Signal
Bollinger Bands
Mildly Bearish
Mildly Bearish
Moving Averages
Bearish (Daily)
KST
Bullish
Bearish
Dow Theory
Mildly Bearish
No Trend
stock-summary Technical Indicator Scale: Bearish, Mildly Bearish, Sideways, Mildly Bullish, Bullish  Turned 
stock-summaryShareholding
Shareholding Snapshot : Jun 2026stock-summary
Shareholding Compare (%holding) stock-summary
Majority shareholders

Promoters

Pledged Promoter Holdings

None

Mutual Funds

Held by 1 Schemes (0.01%)

FIIs

Held by 0 FIIs

Promoter with highest holding

Bilcare Limited (55.99%)

Highest Public shareholder

Rajesh Omkarnath Malpani (3.31%)

Individual Investors Holdings

37.83%

stock-summaryFinancial
[
  {
    "link": "quarterly",
    "btn_text": "All Quarterly Results",
    "header": "Quarterly Results Snapshot (Consolidated) - Mar'26 - QoQ",
    "rhs": [
      {
        "prefix": "Net Sales ",
        "suffix": "QoQ Growth in quarter ended Mar 2026 is 4.43% vs 0.31% in Dec 2025",
        "dir": 1
      },
      {
        "prefix": "Consolidated Net Profit ",
        "suffix": "QoQ Growth in quarter ended Mar 2026 is 145.13% vs 37.32% in Dec 2025",
        "dir": 1
      }
    ],
    "table": {
      "header": [
        "Mar'26",
        "Dec'25",
        "Change(%)"
      ],
      "body": [
        {
          "field": "Net Sales",
          "val1": "183.07",
          "val2": "175.31",
          "chgp": "4.43%",
          "chgp_class": "positive"
        },
        {
          "field": "Operating Profit (PBDIT) excl Other Income",
          "val1": "17.94",
          "val2": "11.90",
          "chgp": "50.76%",
          "chgp_class": "positive"
        },
        {
          "field": "Interest",
          "val1": "18.25",
          "val2": "17.56",
          "chgp": "3.93%",
          "chgp_class": "negative"
        },
        {
          "field": "Exceptional Items",
          "val1": "0.08",
          "val2": "-1.72",
          "chgp": "104.65%",
          "chgp_class": "positive"
        },
        {
          "field": "Consolidate Net Profit",
          "val1": "7.04",
          "val2": "-15.60",
          "chgp": "145.13%",
          "chgp_class": "positive"
        },
        {
          "field": "Operating Profit Margin (Excl OI)",
          "val1": "9.96%",
          "val2": "6.90%",
          "chgp": "3.06%",
          "chgp_class": "positive"
        }
      ]
    }
  },
  {
    "link": "half-yearly",
    "btn_text": "All Half Yearly Results",
    "header": "Half Yearly Results Snapshot (Standalone) - Sep'25",
    "rhs": [
      {
        "prefix": "Net Sales ",
        "suffix": " Growth in half year ended Sep 2025 is -5.22% vs 6.26% in Sep 2024",
        "dir": -1
      },
      {
        "prefix": "Standalone Net Profit ",
        "suffix": " Growth in half year ended Sep 2025 is 16.18% vs -129.05% in Sep 2024",
        "dir": 1
      }
    ],
    "table": {
      "header": [
        "Sep'25",
        "Sep'24",
        "Change(%)"
      ],
      "body": [
        {
          "field": "Net Sales",
          "val1": "347.84",
          "val2": "366.98",
          "chgp": "-5.22%",
          "chgp_class": "negative"
        },
        {
          "field": "Operating Profit (PBDIT) excl Other Income",
          "val1": "10.72",
          "val2": "21.90",
          "chgp": "-51.05%",
          "chgp_class": "negative"
        },
        {
          "field": "Interest",
          "val1": "38.62",
          "val2": "42.40",
          "chgp": "-8.92%",
          "chgp_class": "positive"
        },
        {
          "field": "Exceptional Items",
          "val1": "0.00",
          "val2": "-9.91",
          "chgp": "100.00%",
          "chgp_class": "positive"
        },
        {
          "field": "Standalone Net Profit",
          "val1": "-38.53",
          "val2": "-45.97",
          "chgp": "16.18%",
          "chgp_class": "positive"
        },
        {
          "field": "Operating Profit Margin (Excl OI)",
          "val1": "3.08%",
          "val2": "5.97%",
          "chgp": "-2.89%",
          "chgp_class": "negative"
        }
      ]
    }
  },
  {
    "link": "nine-monthly",
    "btn_text": "All Nine Monthly Results",
    "header": "Nine Monthly Results Snapshot (Standalone) - Dec'25",
    "rhs": [
      {
        "prefix": "Net Sales ",
        "suffix": "YoY Growth in nine months ended Dec 2025 is -6.58% vs 9.53% in Dec 2024",
        "dir": -1
      },
      {
        "prefix": "Standalone Net Profit ",
        "suffix": "YoY Growth in nine months ended Dec 2025 is 15.49% vs -91.28% in Dec 2024",
        "dir": 1
      }
    ],
    "table": {
      "header": [
        "Dec'25",
        "Dec'24",
        "Change(%)"
      ],
      "body": [
        {
          "field": "Net Sales",
          "val1": "518.22",
          "val2": "554.73",
          "chgp": "-6.58%",
          "chgp_class": "negative"
        },
        {
          "field": "Operating Profit (PBDIT) excl Other Income",
          "val1": "22.25",
          "val2": "29.61",
          "chgp": "-24.86%",
          "chgp_class": "negative"
        },
        {
          "field": "Interest",
          "val1": "56.17",
          "val2": "62.54",
          "chgp": "-10.19%",
          "chgp_class": "positive"
        },
        {
          "field": "Exceptional Items",
          "val1": "-1.72",
          "val2": "-19.84",
          "chgp": "91.33%",
          "chgp_class": "positive"
        },
        {
          "field": "Standalone Net Profit",
          "val1": "-54.49",
          "val2": "-64.48",
          "chgp": "15.49%",
          "chgp_class": "positive"
        },
        {
          "field": "Operating Profit Margin (Excl OI)",
          "val1": "4.21%",
          "val2": "5.24%",
          "chgp": "-1.03%",
          "chgp_class": "negative"
        }
      ]
    }
  },
  {
    "link": "annual",
    "btn_text": "All Annual Results",
    "header": "Annual Results Snapshot (Consolidated) - Mar'26",
    "rhs": [
      {
        "prefix": "Net Sales ",
        "suffix": "YoY Growth in year ended Mar 2026 is -4.85% vs 6.72% in Mar 2025",
        "dir": -1
      },
      {
        "prefix": "Consolidated Net Profit ",
        "suffix": "YoY Growth in year ended Mar 2026 is 25.00% vs -21.41% in Mar 2025",
        "dir": 1
      }
    ],
    "table": {
      "header": [
        "Mar'26",
        "Mar'25",
        "Change(%)"
      ],
      "body": [
        {
          "field": "Net Sales",
          "val1": "715.09",
          "val2": "751.51",
          "chgp": "-4.85%",
          "chgp_class": "negative"
        },
        {
          "field": "Operating Profit (PBDIT) excl Other Income",
          "val1": "41.69",
          "val2": "36.85",
          "chgp": "13.13%",
          "chgp_class": "positive"
        },
        {
          "field": "Interest",
          "val1": "74.43",
          "val2": "82.29",
          "chgp": "-9.55%",
          "chgp_class": "positive"
        },
        {
          "field": "Exceptional Items",
          "val1": "-1.64",
          "val2": "-6.05",
          "chgp": "72.89%",
          "chgp_class": "positive"
        },
        {
          "field": "Consolidate Net Profit",
          "val1": "-47.00",
          "val2": "-62.67",
          "chgp": "25.00%",
          "chgp_class": "positive"
        },
        {
          "field": "Operating Profit Margin (Excl OI)",
          "val1": "5.94%",
          "val2": "4.99%",
          "chgp": "0.95%",
          "chgp_class": "positive"
        }
      ]
    }
  }
]

Quarterly Results Snapshot (Consolidated) - Mar'26 - QoQstock-summary

Mar'26
Dec'25
Change(%)
Net Sales
183.07
175.31
4.43%
Operating Profit (PBDIT) excl Other Income
17.94
11.90
50.76%
Interest
18.25
17.56
3.93%
Exceptional Items
0.08
-1.72
104.65%
Consolidate Net Profit
7.04
-15.60
145.13%
Operating Profit Margin (Excl OI)
9.96%
6.90%
3.06%
Values in Rs Cr.
Direction Arrows
Net Sales

QoQ Growth in quarter ended Mar 2026 is 4.43% vs 0.31% in Dec 2025

Direction Arrows
Consolidated Net Profit

QoQ Growth in quarter ended Mar 2026 is 145.13% vs 37.32% in Dec 2025

Half Yearly Results Snapshot (Standalone) - Sep'25stock-summary

Sep'25
Sep'24
Change(%)
Net Sales
347.84
366.98
-5.22%
Operating Profit (PBDIT) excl Other Income
10.72
21.90
-51.05%
Interest
38.62
42.40
-8.92%
Exceptional Items
0.00
-9.91
100.00%
Standalone Net Profit
-38.53
-45.97
16.18%
Operating Profit Margin (Excl OI)
3.08%
5.97%
-2.89%
Values in Rs Cr.
Direction Arrows
Net Sales

Growth in half year ended Sep 2025 is -5.22% vs 6.26% in Sep 2024

Direction Arrows
Standalone Net Profit

Growth in half year ended Sep 2025 is 16.18% vs -129.05% in Sep 2024

Nine Monthly Results Snapshot (Standalone) - Dec'25stock-summary

Dec'25
Dec'24
Change(%)
Net Sales
518.22
554.73
-6.58%
Operating Profit (PBDIT) excl Other Income
22.25
29.61
-24.86%
Interest
56.17
62.54
-10.19%
Exceptional Items
-1.72
-19.84
91.33%
Standalone Net Profit
-54.49
-64.48
15.49%
Operating Profit Margin (Excl OI)
4.21%
5.24%
-1.03%
Values in Rs Cr.
Direction Arrows
Net Sales

YoY Growth in nine months ended Dec 2025 is -6.58% vs 9.53% in Dec 2024

Direction Arrows
Standalone Net Profit

YoY Growth in nine months ended Dec 2025 is 15.49% vs -91.28% in Dec 2024

Annual Results Snapshot (Consolidated) - Mar'26stock-summary

Mar'26
Mar'25
Change(%)
Net Sales
715.09
751.51
-4.85%
Operating Profit (PBDIT) excl Other Income
41.69
36.85
13.13%
Interest
74.43
82.29
-9.55%
Exceptional Items
-1.64
-6.05
72.89%
Consolidate Net Profit
-47.00
-62.67
25.00%
Operating Profit Margin (Excl OI)
5.94%
4.99%
0.95%
Values in Rs Cr.
Direction Arrows
Net Sales

YoY Growth in year ended Mar 2026 is -4.85% vs 6.72% in Mar 2025

Direction Arrows
Consolidated Net Profit

YoY Growth in year ended Mar 2026 is 25.00% vs -21.41% in Mar 2025

stock-summaryCompany CV
About Caprihans India Ltd stock-summary
stock-summary
Caprihans India Ltd
Micro Cap
Plastic Products - Industrial
Incorporated in Apr.'46, Caprihans India Ltd went public in 1978. In 1983, the company changed hands and was made a part of The Kalpataru Construction Group. Caprihans is one of the largest manufacturers of PVC Films, consisting of both Flexible and Rigid. The Company is one of the leading players in pharma/non pharma packaging industry in India, producing high quality products. It operates from two plants located at Thane and Nashik, Maharashtra.
Company Coordinates stock-summary
Company Details
Block -D Shivsagar Estate, Dr Annie Besant Road Worli Mumbai Maharashtra : 400018
stock-summary
Tel: 24978660/24978661
stock-summary
cil@caprihansindia.com
Registrar Details
Link Intime India Pvt Ltd, C-13 Pannalal Silk Compound, L B S Marg, Bhandup , Mumbai