
Compare Mercury EV-Tech with Similar Stocks
Dashboard
With a Operating Losses, the company has a Weak Long Term Fundamental Strength
- Low ability to service debt as the company has a high Debt to EBITDA ratio of 0.69 times
- The company has been able to generate a Return on Equity (avg) of 3.36% signifying low profitability per unit of shareholders funds
With a fall in Operating Profit of -1.66%, the company declared Very Negative results in Mar 26
With ROE of 3.1, it has a Very Expensive valuation with a 2.3 Price to Book Value
Despite the size of the company, domestic mutual funds hold only 0% of the company
Total Returns (Price + Dividend) 
Mercury EV-Tech for the last several years.
Risk Adjusted Returns v/s
Returns Beta

News

Mercury EV-Tech Ltd is Rated Strong Sell
Mercury EV-Tech Ltd is rated Strong Sell by MarketsMOJO, with this rating last updated on 13 February 2026. However, the analysis and financial metrics discussed here reflect the stock’s current position as of 26 June 2026, providing investors with the latest insights into the company’s performance and outlook.
Read full news article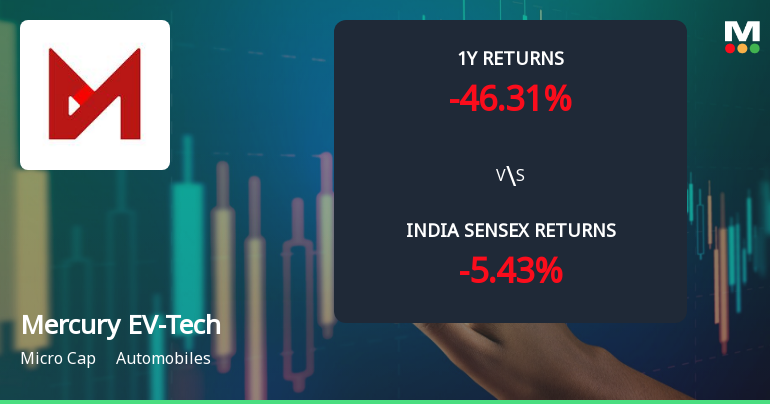
Mercury EV-Tech Ltd Technical Momentum Shifts Amid Mixed Market Signals
Mercury EV-Tech Ltd, a micro-cap player in the automobile sector, has exhibited a nuanced shift in its technical momentum, moving from a bearish stance to a mildly bearish outlook. Despite a modest day gain of 1.98% to close at ₹32.00, the stock’s technical indicators present a complex picture, reflecting both cautious optimism and lingering bearish pressures.
Read full news article
Mercury EV-Tech Ltd Faces Bearish Momentum Amid Mixed Technical Signals
Mercury EV-Tech Ltd, a micro-cap player in the automobile sector, is currently exhibiting a pronounced bearish momentum as multiple technical indicators signal a shift in price dynamics. Despite a stable closing price of ₹30.77, the stock’s technical trend has deteriorated from mildly bearish to outright bearish, reflecting growing investor caution amid subdued price action and weak relative strength compared to benchmarks.
Read full news article Announcements
Intimation Of Listing Ceremony On NSE
03-Jun-2026 | Source : BSEIntimation of Listing Ceremony on NSE
Announcement under Regulation 30 (LODR)-Newspaper Publication
01-Jun-2026 | Source : BSEIntimation of Newspaper Advertisement
Board Meeting Outcome for Baord Meeting Outcome
31-May-2026 | Source : BSEBaord Meeting Outcome
Corporate Actions

No Upcoming Board Meetings

No Dividend history available

No Splits history available

No Bonus history available

Mercury EV-Tech Ltd has announced 23:1 rights issue, ex-date: 04 Aug 22
Quality key factors
Valuation key factors
Technicals key factors
 Technical Indicator Scale: Bearish, Mildly Bearish, Sideways, Mildly Bullish, Bullish Turned
 Shareholding Snapshot : Jun 2026
Shareholding Compare (%holding)
Promoters
None
Held by 0 Schemes
Held by 5 FIIs (1.7%)
Shree Saibaba Exim Private Limited (22.63%)
Forbes Emf (1.58%)
32.28%
Quarterly Results Snapshot (Consolidated) - Mar'26 - QoQ

QoQ Growth in quarter ended Mar 2026 is -20.09% vs -25.64% in Dec 2025

QoQ Growth in quarter ended Mar 2026 is -66.29% vs -48.26% in Dec 2025
Half Yearly Results Snapshot (Consolidated) - Sep'25
Growth in half year ended Sep 2025 is 142.27% vs 96.71% in Sep 2024
Growth in half year ended Sep 2025 is 43.75% vs 55.22% in Sep 2024
Nine Monthly Results Snapshot (Consolidated) - Dec'25
YoY Growth in nine months ended Dec 2025 is 38.86% vs 258.36% in Dec 2024
YoY Growth in nine months ended Dec 2025 is -38.99% vs 240.11% in Dec 2024
Annual Results Snapshot (Consolidated) - Mar'26
YoY Growth in year ended Mar 2026 is 13.88% vs 307.08% in Mar 2025
YoY Growth in year ended Mar 2026 is -44.12% vs 275.88% in Mar 2025
About Mercury EV-Tech Ltd

Company Coordinates


