
Compare Mercury EV-Tech with Similar Stocks
Dashboard
With a Operating Losses, the company has a Weak Long Term Fundamental Strength
- Low ability to service debt as the company has a high Debt to EBITDA ratio of 0.69 times
- The company has been able to generate a Return on Equity (avg) of 3.36% signifying low profitability per unit of shareholders funds
With a fall in Operating Profit of -1.66%, the company declared Very Negative results in Mar 26
With ROE of 3.1, it has a Very Expensive valuation with a 2.4 Price to Book Value
Despite the size of the company, domestic mutual funds hold only 0% of the company
Total Returns (Price + Dividend) 
Mercury EV-Tech for the last several years.
Risk Adjusted Returns v/s
Returns Beta

News

Mercury EV-Tech Ltd is Rated Strong Sell
Mercury EV-Tech Ltd is rated Strong Sell by MarketsMOJO, with this rating last updated on 13 February 2026. However, the analysis and financial metrics presented here reflect the stock's current position as of 29 July 2026, providing investors with an up-to-date view of the company’s fundamentals, valuation, financial trends, and technical outlook.
Read full news article
Mercury EV-Tech Ltd Technical Momentum Shifts Amid Mixed Indicator Signals
Mercury EV-Tech Ltd, a micro-cap player in the automobile sector, has experienced a notable shift in its technical momentum, moving from a sideways trend to a mildly bearish stance. Despite a day gain of 3.21%, the stock’s technical indicators present a complex picture, with some signals bullish and others bearish, reflecting a nuanced outlook for investors navigating this evolving landscape.
Read full news article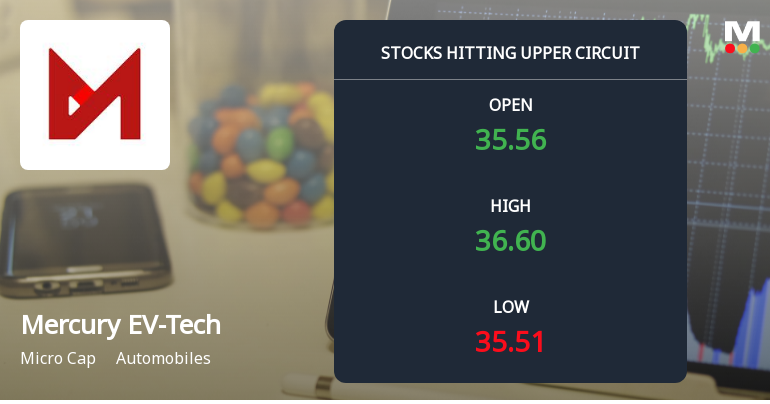
Mercury EV-Tech Ltd Locks at Upper Circuit With 5% Gain Amid Delivery Dip and Mixed Technical Signals
At Rs 36.86, Mercury EV-Tech Ltd reached its upper circuit limit of 5% on 27 Jul 2026, with buyers lined up but no sellers willing to part with shares. This price band capped the stock’s daily gain, signalling unfilled demand despite a modest 1.62% rise in the last traded price to Rs 35.68.
Read full news article Announcements
Intimation Under Regulation 30 Of The Securities And Exchange Board Of India (Listing Obligations And Disclosure Requirements) Regulations 2015 - Business Update
15-Jul-2026 | Source : BSEIntimation of Business Update
Compliances-Certificate under Reg. 74 (5) of SEBI (DP) Regulations 2018
14-Jul-2026 | Source : BSEIntimation of Certificate under Reg. 74(5) of SEBI(DP) Regulations 2018 for the quarter ended June 30 2026
Intimation Of Opening Of Signature Showroom
25-Jun-2026 | Source : BSEIntimation of opening of Signature Showroom
Corporate Actions

No Upcoming Board Meetings

No Dividend history available

No Splits history available

No Bonus history available

Mercury EV-Tech Ltd has announced 23:1 rights issue, ex-date: 04 Aug 22
Quality key factors
Valuation key factors
Technicals key factors
 Technical Indicator Scale: Bearish, Mildly Bearish, Sideways, Mildly Bullish, Bullish Turned
 Shareholding Snapshot : Jun 2026
Shareholding Compare (%holding)
Promoters
None
Held by 0 Schemes
Held by 5 FIIs (1.7%)
Shree Saibaba Exim Private Limited (22.63%)
Moolchand Kiran Kumar Jain (2.59%)
32.25%
Quarterly Results Snapshot (Consolidated) - Mar'26 - QoQ

QoQ Growth in quarter ended Mar 2026 is -20.09% vs -25.64% in Dec 2025

QoQ Growth in quarter ended Mar 2026 is -66.29% vs -48.26% in Dec 2025
Half Yearly Results Snapshot (Consolidated) - Sep'25
Growth in half year ended Sep 2025 is 142.27% vs 96.71% in Sep 2024
Growth in half year ended Sep 2025 is 43.75% vs 55.22% in Sep 2024
Nine Monthly Results Snapshot (Consolidated) - Dec'25
YoY Growth in nine months ended Dec 2025 is 38.86% vs 258.36% in Dec 2024
YoY Growth in nine months ended Dec 2025 is -38.99% vs 240.11% in Dec 2024
Annual Results Snapshot (Consolidated) - Mar'26
YoY Growth in year ended Mar 2026 is 13.88% vs 307.08% in Mar 2025
YoY Growth in year ended Mar 2026 is -44.12% vs 275.88% in Mar 2025
About Mercury EV-Tech Ltd

Company Coordinates


