
Compare Triton Valves with Similar Stocks
Dashboard
Weak Long Term Fundamental Strength with an average Return on Capital Employed (ROCE) of 6.28%
- Poor long term growth as Operating profit has grown by an annual rate 18.52% of over the last 5 years
- Low ability to service debt as the company has a high Debt to EBITDA ratio of 3.28 times
With a growth in Net Profit of 36.36%, the company declared Very Positive results in Mar 26
With ROCE of 10.9, it has a Fair valuation with a 2.8 Enterprise value to Capital Employed
Despite the size of the company, domestic mutual funds hold only 0% of the company
Stock DNA
Auto Components & Equipments
INR 566 Cr (Micro Cap)
60.00
38
0.21%
1.00
7.58%
4.35
Total Returns (Price + Dividend) 
Latest dividend: 2.5 per share ex-dividend date: Sep-19-2025
Risk Adjusted Returns v/s
Returns Beta

News

Triton Valves Ltd is Rated Hold by MarketsMOJO
Triton Valves Ltd is rated 'Hold' by MarketsMOJO, with this rating last updated on 01 June 2026. However, the analysis and financial metrics discussed here reflect the stock's current position as of 05 July 2026, providing investors with an up-to-date view of the company’s fundamentals, returns, and market performance.
Read full news article
Triton Valves Ltd is Rated Hold by MarketsMOJO
Triton Valves Ltd is rated 'Hold' by MarketsMOJO, with this rating last updated on 01 June 2026. However, the analysis and financial metrics discussed here reflect the company’s current position as of 24 June 2026, providing investors with the latest insights into its performance and outlook.
Read full news article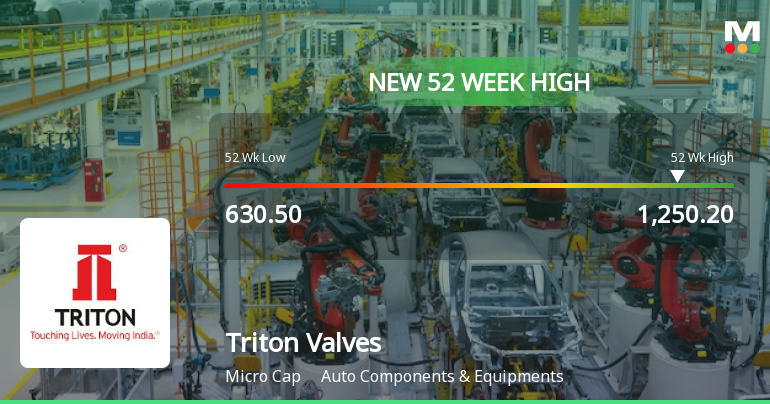
Triton Valves Ltd Hits New 52-Week High of Rs 1250.2 on Back of Strong Technical Signals
Delivering a remarkable 73.0% return over the past year, Triton Valves Ltd surged to a fresh 52-week high of Rs 1250.2 on 18 Jun 2026, significantly outperforming the Sensex which declined 5.1% over the same period. This milestone caps a sustained rally fuelled by robust technical momentum and broad-based buying interest.
Read full news article Announcements
Closure of Trading Window
25-Jun-2026 | Source : BSEplease find attached intimation for closure of trading window for the quarter ended June 30 2026
Announcement under Regulation 30 (LODR)-Earnings Call Transcript
05-Jun-2026 | Source : BSEPlease find enclosed here with transcript of Q4 and year ended 31.03.2026 earnings call which was held on 29.05.2026
Intimation Regarding Honble NCLT Bengaluru Bench Order Update As Per (SEBI LODR) Regulations. 2015
03-Jun-2026 | Source : BSEPlease find the attached order details as per SEBI (LODR) Regulations 2015
Corporate Actions

No Upcoming Board Meetings

Triton Valves Ltd has declared 100% dividend, ex-date: 19 Sep 25

No Splits history available

Triton Valves Ltd has announced 3:1 bonus issue, ex-date: 30 Mar 26

No Rights history available
Quality key factors
Valuation key factors
Technicals key factors
 Technical Indicator Scale: Bearish, Mildly Bearish, Sideways, Mildly Bullish, Bullish Turned
 Shareholding Snapshot : Mar 2026
Shareholding Compare (%holding)
Non Institution
None
Held by 0 Schemes
Held by 0 FIIs
Maruti Anuradha Gokarn (25.77%)
Hemant Jagdish Ashar (5.47%)
46.57%
Quarterly Results Snapshot (Consolidated) - Mar'26 - QoQ

QoQ Growth in quarter ended Mar 2026 is 4.31% vs 16.06% in Dec 2025

QoQ Growth in quarter ended Mar 2026 is 36.36% vs 36.08% in Dec 2025
Half Yearly Results Snapshot (Consolidated) - Sep'25
Growth in half year ended Sep 2025 is 18.72% vs 7.60% in Sep 2024
Growth in half year ended Sep 2025 is -2.53% vs 196.67% in Sep 2024
Nine Monthly Results Snapshot (Consolidated) - Dec'25
YoY Growth in nine months ended Dec 2025 is 21.13% vs 7.03% in Dec 2024
YoY Growth in nine months ended Dec 2025 is 31.97% vs 144.97% in Dec 2024
Annual Results Snapshot (Consolidated) - Mar'26
YoY Growth in year ended Mar 2026 is 18.44% vs 14.02% in Mar 2025
YoY Growth in year ended Mar 2026 is 89.65% vs 82.21% in Mar 2025
About Triton Valves Ltd

Company Coordinates


