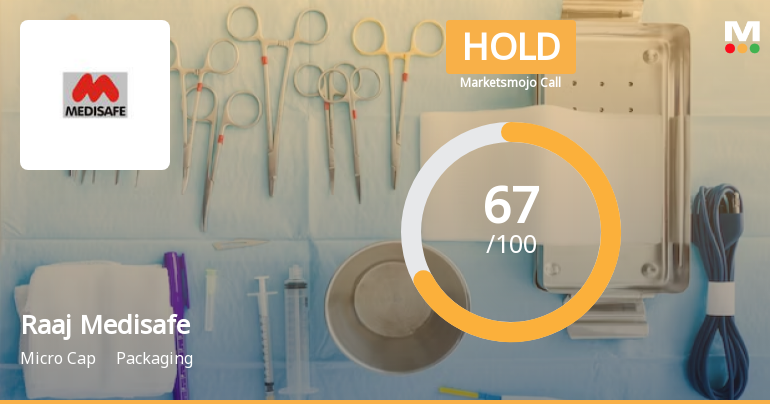
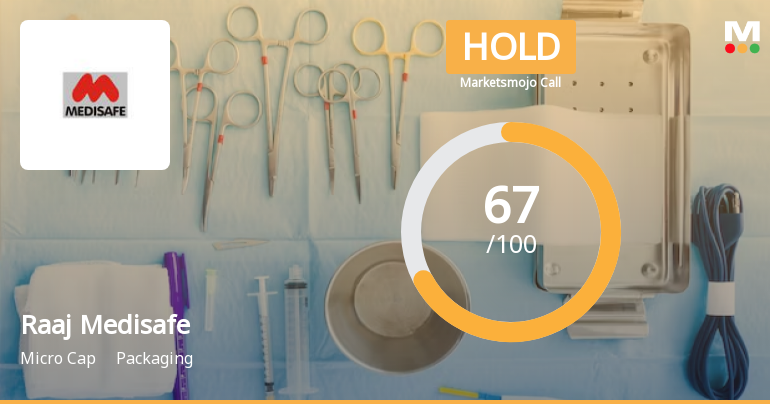
Raaj Medisafe

  • Market Cap: Micro Cap
  • Industry: Packaging
  • ISIN: INE548H01015
  • NSEID:
  • BSEID: 524502
INR
97.00
-2.17 (-2.19%)
BSENSE

Sep 22, 03:30 PM

BSE+NSE Vol: 1.15 k

  • Price Points
  • Score
  • Mojo Parameters
  • Total Return
  • News and Corporate Actions
  • Key factors
  • Shareholding
  • Financials
  • CompanyCV
stock-summaryPrice Point
High/Low

1Day

52 Week

Valuation
Technical
Day's Volume

CASH

1.15 k (9.84%) Volume

Shareholding (Jun 2026)

FII

0.00%

Held by 0 FIIs

DII

0.00%

Held by 0 DIIs

Promoter

59.08%

Why is Raaj Medisafe India Ltd falling/rising?

06-Sep-2026

As of 05-Sep, Raaj Medisafe India Ltd's stock price is declining at 96.43, down 5.0%. Despite strong long-term gains, recent trends show a short-term decline influenced by sector performance and reduced investor activity.

As of 05-Sep, Raaj Medisafe India Ltd's stock price is falling, currently at 96.43, reflecting a decrease of 5.07 or 5.0%. The stock has been underperforming, having lost 5.94% over the last two days and opening with a loss of 2.46% today. Additionally, it has underperformed its sector by 1.46%. The medical equipment sector, in which Raaj Medisafe operates, has also seen a decline of 3.52%. <BR><BR>Investor participation appears to be waning, as evidenced by a significant drop in delivery volume, which fell by 78.65% compared to the five-day average. Despite these recent challenges, the stock has shown strong performance over longer periods, such as a 36.39% increase over the past month and a 175.44% increase over the last three years. However, the current trend indicates a short-term decline, influenced by both sector performance and reduced investor activity.

View full answer

Who are in the management team of Raaj Medisafe?

01-Sep-2026

The management team of Raaj Medisafe includes Arpit Bangur (Chairman), Navin Jhawar (Managing Director), and three Independent Directors: Rajesh Kumar Gupta, Vijendra Kumar Sood, and Krishna Jajoo, along with Sachin Sarda (Company Secretary & Compliance Officer).

The management team of Raaj Medisafe includes the following individuals:<BR><BR>1. **Arpit Bangur** - Chairman (Non-Executive)<BR>2. **Rajesh Kumar Gupta** - Independent Director<BR>3. **Vijendra Kumar Sood** - Independent Director<BR>4. **Krishna Jajoo** - Independent Director<BR>5. **Sachin Sarda** - Company Secretary & Compliance Officer<BR>6. **Navin Jhawar** - Managing Director<BR><BR>If you need more details about their roles or the company, feel free to ask!

View full answer

What does Raaj Medisafe do?

01-Sep-2026

Raaj Medisafe India Ltd manufactures medical disposable devices and operates in the micro cap segment of the packaging industry. As of June 2026, it reported net sales of 29 Cr and a net profit of 2 Cr, with a market cap of INR 155 Cr.

Overview:<BR>Raaj Medisafe India Ltd is engaged in the manufacturing of medical disposable devices and operates within the micro cap segment of the packaging industry.<BR><BR>History:<BR>The company was incorporated in September 1985 under the name Manoj Surgical Industries Limited, which was later changed to Raaj Medisafe India Limited in July 2008. The latest reported quarterly results indicate net sales and net profit for June 2026.<BR><BR>Financial Snapshot:<BR>- Net Sales: 29 Cr (Quarterly Results - Jun 2026)<BR>- Net Profit: 2 Cr (Quarterly Results - Jun 2026)<BR>- Market Cap: INR 155 Cr (Micro Cap)<BR><BR>Key Metrics:<BR>- P/E: 68.00<BR>- Industry P/E: 112<BR>- Dividend Yield: 0.00%<BR>- Debt Equity: 1.10<BR>- Return on Equity: 5.05%<BR>- Price to Book: 3.25<BR><BR>Contact Details:<BR>Address: 106 Sector III, Industrial Area Pithampur Dhar Madhya Pradesh : 454774<BR>Tel: 91-7292-403192<BR>Email: info@medisafeindia.com<BR>Website: http://www.raajmedisafeindia.com

View full answer

Who are the peers of the Raaj Medisafe?

01-Sep-2026

Raaj Medisafe's peers include Emmbi Industries, Swadeshi Inds, Kaira Can, Hind.Tin Works, AMD Industries, Rollatainers, Barflex Polyfilm, and Mega Flex Plast. Raaj Medisafe has an average management risk, excellent growth, and a 1-year return of 16.65%, which is higher than Hind.Tin Works but lower than Swadeshi Inds.

Peers: The peers of Raaj Medisafe are Emmbi Industries, Swadeshi Inds, Kaira Can, Hind.Tin Works, AMD Industries, Rollatainers, Barflex Polyfilm, and Mega Flex Plast.<BR><BR>Quality Snapshot: Excellent management risk is observed at Swadeshi Inds, while Average management risk is found at Emmbi Industries, Raaj Medisafe, Kaira Can, Hind.Tin Works, and Barflex Polyfilm, and the rest. Good growth is noted at Swadeshi Inds and Mega Flex Plast, while Excellent growth is attributed to Raaj Medisafe, and the rest show Below Average growth. Excellent capital structure is present at Kaira Can and Barflex Polyfilm, while Below Average capital structure is found at Emmbi Industries, Raaj Medisafe, Hind.Tin Works, AMD Industries, Rollatainers, and the rest.<BR><BR>Return Snapshot: The peer with the highest 1-year return is Swadeshi Inds at 42.31%, while the lowest is Hind.Tin Works at -17.30%. Raaj Medisafe's 1-year return is 16.65%, which is higher than Hind.Tin Works but lower than Swadeshi Inds. Additionally, the six-month return is negative for Hind.Tin Works and AMD Industries.

View full answer

How big is Raaj Medisafe?

01-Sep-2026

As of 31st August, Raaj Medisafe India Ltd has a market capitalization of 155.00 Cr, with recent net sales of 1.05 Cr and a net profit loss of 0.00 Cr. Shareholder's funds are 46.74 Cr and total assets amount to 121.35 Cr.

As of 31st August, Raaj Medisafe India Ltd has a market capitalization of 155.00 Cr, categorizing it as a Micro Cap company.<BR><BR>In the latest four quarters, Raaj Medisafe reported Net Sales of 1.05 Cr. The Net Profit for the same period was a loss of 0.00 Cr.<BR><BR>The latest annual reporting period shows Shareholder's Funds of 46.74 Cr and Total Assets of 121.35 Cr.

View full answer

Should I buy, sell or hold Raaj Medisafe India Ltd?

14-Aug-2026

When is the next results date for Raaj Medisafe India Ltd?

05-Aug-2026

The next results date for Raaj Medisafe India Ltd is 12 August 2026.

The next results date for Raaj Medisafe India Ltd is scheduled for 12 August 2026.

View full answer

Are Raaj Medisafe India Ltd latest results good or bad?

12-Feb-2026

Raaj Medisafe India Ltd's latest results for FY25 are strong, with a 44.2% revenue increase to ₹62.00 crores and a net profit doubling to ₹6.00 crores. However, concerns about a slight decrease in operating margin and a high debt-to-equity ratio suggest potential risks for investors.

Raaj Medisafe India Ltd's latest results for FY25 indicate a strong performance overall, showcasing significant growth and profitability. The company reported an annual revenue of ₹62.00 crores, which is a remarkable increase of 44.2% year-on-year. Additionally, net profit doubled to ₹6.00 crores, reflecting a 100% increase compared to the previous fiscal year. This growth is complemented by an impressive average return on equity (ROE) of 82.82%, highlighting the company's efficiency in generating returns for shareholders.<BR><BR>Despite these positive indicators, there are some concerns to consider. The operating margin has slightly decreased to 12.9% from 14.0% in FY24, indicating some pressure on operational efficiency as the company scales. Moreover, the company operates with a high debt-to-equity ratio of 1.77, which raises questions about its leverage and ability to manage debt, especially as interest costs have also increased.<BR><BR>In summary, while Raaj Medisafe India Ltd has demonstrated exceptional growth and profitability, the high leverage and slight margin pressure warrant careful monitoring. Overall, the results can be viewed as good, but potential investors should be aware of the associated risks.

View full answer

How has been the historical performance of Raaj Medisafe?

28-Nov-2025

Raaj Medisafe has shown significant growth from March 2019 to March 2025, with net sales increasing from 4.80 Cr to 62.42 Cr and a turnaround from losses to profits in operating profit, profit before tax, and profit after tax. Total assets rose from 13.59 Cr to 68.06 Cr, indicating strong financial recovery and growth.

Answer:<BR>The historical performance of Raaj Medisafe shows significant growth in net sales and profitability over the years, culminating in the fiscal year ending March 2025.<BR><BR>Breakdown:<BR>Raaj Medisafe's net sales have increased from 4.80 Cr in March 2019 to 62.42 Cr in March 2025, reflecting a robust growth trajectory. Total operating income followed a similar trend, rising from 4.80 Cr in March 2019 to 62.42 Cr in March 2025. The company's operating profit (PBDIT) has also improved, moving from a loss of 0.78 Cr in March 2019 to a profit of 8.83 Cr in March 2025. Profit before tax has shown a positive trend, increasing from a loss of 1.59 Cr in March 2019 to a profit of 5.25 Cr in March 2025, while profit after tax reached 6.13 Cr in March 2025, up from a loss of 1.36 Cr in March 2020. The company's total assets have expanded significantly from 13.59 Cr in March 2020 to 68.06 Cr in March 2025, with total liabilities also increasing from 13.59 Cr to 34.51 Cr during the same period. Cash flow from operating activities remained stable, while cash flow from investing activities showed a negative trend, indicating ongoing investments in growth. Overall, Raaj Medisafe has demonstrated a strong recovery and growth in its financial performance over the years.

View full answer

Who are the top shareholders of the Raaj Medisafe?

17-Jul-2025

The top shareholders of Raaj Medisafe include Sushen Remedies Private Limited with 19.14%, individual investors with 23.05%, and Ramesh Chand Maheshvari as the highest public shareholder at 2.42%. There are no mutual funds or foreign institutional investors currently holding shares in the company.

The top shareholders of Raaj Medisafe include the promoters, with Sushen Remedies Private Limited holding the largest stake at 19.14%. Additionally, individual investors collectively own 23.05% of the company. The highest public shareholder is Ramesh Chand Maheshvari, who holds 2.42%. There are currently no mutual funds or foreign institutional investors (FIIs) holding shares in the company.

View full answer

Is Raaj Medisafe overvalued or undervalued?

09-Jun-2025

As of May 27, 2025, Raaj Medisafe's valuation has improved to very attractive, with strong growth potential indicated by a PE ratio of 17.03, an EV to EBITDA of 15.33, and a PEG ratio of 0.33, making it undervalued compared to peers like Poly Medicure and Blue Jet Health, despite recent underperformance against the Sensex.

As of 27 May 2025, the valuation grade for Raaj Medisafe has moved from attractive to very attractive, indicating a positive shift in its investment appeal. The company is currently undervalued, with a PE ratio of 17.03, an EV to EBITDA of 15.33, and a PEG ratio of 0.33, suggesting strong growth potential relative to its price. <BR><BR>In comparison to peers, Raaj Medisafe's valuation metrics stand out, particularly when contrasted with Poly Medicure, which has a PE ratio of 66.7, and Blue Jet Health at 51.29, both categorized as very expensive. The company's return on equity (ROE) is notably high at 27.28%, further reinforcing its attractive valuation. Despite recent underperformance against the Sensex, with a year-to-date return of -8.43% compared to the Sensex's 5.59%, the long-term performance over three and five years shows significant outperformance, suggesting that the current price presents a compelling buying opportunity.

View full answer

What is the technical trend for Raaj Medisafe?

09-Jun-2025

As of June 3, 2025, Raaj Medisafe's technical trend is mildly bearish, influenced by daily moving averages and a monthly MACD, despite some mixed signals from the weekly MACD and Bollinger Bands.

As of 3 June 2025, the technical trend for Raaj Medisafe has changed from sideways to mildly bearish. The weekly MACD is bullish, but the monthly MACD is mildly bearish, indicating mixed signals. The daily moving averages are mildly bearish, reinforcing the current trend. The Bollinger Bands show a mildly bullish stance on both weekly and monthly time frames, which contrasts with the overall bearish sentiment. The KST is bullish weekly but mildly bearish monthly, while Dow Theory indicates a mildly bearish trend on the weekly chart. Overall, the current technical stance is mildly bearish, driven primarily by the daily moving averages and the monthly MACD.

View full answer

Has Raaj Medisafe declared dividend?

06-Jun-2025

No Dividend History Available

iScoreScore
Click here to find our call on this stock
Strong Sell
Sell
Hold
Buy
Strong Buy

Dashboard

1

Healthy long term growth as Net Sales has grown by an annual rate of 33.80% and Operating profit at 40.62%

 
2

Positive results in Jun 26

3

With ROCE of 9.9, it has a Very Attractive valuation with a 2.1 Enterprise value to Capital Employed

4

Promoter holding has decreased this quarter and now hold 59.08% of the company

 
5

Market Beating performance in long term as well as near term

stock-summaryMojo Parameters

Mojo Parameters

Loading Valuation Snapshot...

Stock DNA

stock-summary
Industry

Packaging

stock-summary
Market cap

INR 163 Cr (Micro Cap)

stock-summary
P/E

68.00

stock-summary
Industry P/E

119

stock-summary
Dividend Yield

0.00%

stock-summary
Debt Equity

1.10

stock-summary
Return on Equity

5.05%

stock-summary
Price to Book

3.50

Revenue and Profits:
Net Sales:
29 Cr
(Quarterly Results - Jun 2026)
Net Profit:
2 Cr
stock-summaryTotal Returns
Total Returns (Price + Dividend) stock-summary
Dividend Yield (0%)
TimePeriod
Price Return
Dividend Return
Total Return
3 Months
31.06%
0%
31.06%
6 Months
31.95%
0%
31.95%
1 Year
43.28%
0%
43.28%
2 Years
-12.02%
0%
-12.02%
3 Years
162.09%
0%
162.09%
4 Years
138.62%
0%
138.62%
5 Years
127.43%
0%
127.43%

Raaj Medisafe for the last several years.

Risk Adjusted Returns v/s stock-summary
Returns Beta
Icon
Beta has not been calculated since enough price history is not available
stock-summaryNews & Corporate Actions

Announcements stock-summary

Shareholder Meeting / Postal Ballot-Outcome of AGM

21-Sep-2026 | Source : BSE

The Outcome of the AGM held on 21st September 2026 held at 03.00 P.M. and concluded at 03.41 P.M. (including 15 minutes for E- voting after the conclusion of the meeting) as per letter attached herewith.

Closure of Trading Window

19-Sep-2026 | Source : BSE

Trading window of the Company will remained closed for dealing in Companys shares for Promoters/Directors/designated employees/officers and their immediate relatives from 01.10.2026 till 48 hours of the declaration of Un-audited Financial Results for the quarter ending on September 30 2026

Disclosures under Reg. 29(1) of SEBI (SAST) Regulations 2011

16-Sep-2026 | Source : BSE

The Exchange has received the disclosure under Regulation 29(1) of SEBI (Substantial Acquisition of Shares & Takeovers) Regulations 2011 for Vishnu Jajoo HUF & PACs

Corporate Actions stock-summary

stock-summary
BOARD MEETING

No Upcoming Board Meetings

stock-summary
DIVIDEND

No Dividend history available

stock-summary
SPLITS

No Splits history available

stock-summary
BONUS

No Bonus history available

stock-summary
RIGHTS

No Rights history available

stock-summaryKey Factors

Quality key factors stock-summary

Factor
Value
Sales Growth (5y)
33.80%
EBIT Growth (5y)
40.62%
EBIT to Interest (avg)
3.67
Debt to EBITDA (avg)
4.57
Net Debt to Equity (avg)
1.10
Sales to Capital Employed (avg)
1.26
Tax Ratio
68.31%
Dividend Payout Ratio
0
Pledged Shares
0
Institutional Holding
0
ROCE (avg)
15.08%
ROE (avg)
38.47%

Valuation key factors

Factor
Value
P/E Ratio
68
Industry P/E
119
Price to Book Value
3.41
EV to EBIT
19.24
EV to EBITDA
15.93
EV to Capital Employed
2.15
EV to Sales
2.25
PEG Ratio
NA
Dividend Yield
NA
ROCE (Latest)
9.94%
ROE (Latest)
5.05%

Technicals key factors

Indicator
Weekly
Monthly
MACD
Bullish
Bullish
RSI
No Signal
No Signal
Bollinger Bands
Mildly Bullish
Mildly Bullish
Moving Averages
Bullish (Daily)
KST
Bullish
Mildly Bearish
Dow Theory
Mildly Bullish
Mildly Bullish
OBV
No Trend
Bullish
stock-summary Technical Indicator Scale: Bearish, Mildly Bearish, Sideways, Mildly Bullish, Bullish  Turned 
stock-summaryShareholding
Shareholding Snapshot : Jun 2026stock-summary
Shareholding Compare (%holding) stock-summary
Majority shareholders

Promoters

Pledged Promoter Holdings

None

Mutual Funds

Held by 0 Schemes

FIIs

Held by 0 FIIs

Promoter with highest holding

Sushen Remedies Private Limited (19.24%)

Highest Public shareholder

Seema Patel (3.32%)

Individual Investors Holdings

35.96%

stock-summaryFinancial
[
  {
    "link": "quarterly",
    "btn_text": "All Quarterly Results",
    "header": "Quarterly Results Snapshot (Standalone) - Jun'26 - YoY",
    "rhs": [
      {
        "prefix": "Net Sales ",
        "suffix": "YoY Growth in quarter ended Jun 2026 is 86.10% vs 45.10% in Jun 2025",
        "dir": 1
      },
      {
        "prefix": "Standalone Net Profit ",
        "suffix": "YoY Growth in quarter ended Jun 2026 is 34.93% vs 50.52% in Jun 2025",
        "dir": -1
      }
    ],
    "table": {
      "header": [
        "Jun'26",
        "Jun'25",
        "Change(%)"
      ],
      "body": [
        {
          "field": "Net Sales",
          "val1": "29.46",
          "val2": "15.83",
          "chgp": "86.10%",
          "chgp_class": "positive"
        },
        {
          "field": "Operating Profit (PBDIT) excl Other Income",
          "val1": "4.06",
          "val2": "2.63",
          "chgp": "54.37%",
          "chgp_class": "positive"
        },
        {
          "field": "Interest",
          "val1": "0.86",
          "val2": "0.68",
          "chgp": "26.47%",
          "chgp_class": "negative"
        },
        {
          "field": "Exceptional Items",
          "val1": "0.00",
          "val2": "0.00",
          "chgp": "",
          "chgp_class": "neutral"
        },
        {
          "field": "Standalone Net Profit",
          "val1": "1.97",
          "val2": "1.46",
          "chgp": "34.93%",
          "chgp_class": "positive"
        },
        {
          "field": "Operating Profit Margin (Excl OI)",
          "val1": "13.78%",
          "val2": "16.61%",
          "chgp": "-2.83%",
          "chgp_class": "negative"
        }
      ]
    }
  },
  {
    "link": "half-yearly",
    "btn_text": "All Half Yearly Results",
    "header": "Half Yearly Results Snapshot (Standalone) - Sep'25",
    "rhs": [
      {
        "prefix": "Net Sales ",
        "suffix": " Growth in half year ended Sep 2025 is 46.09% vs 7.87% in Sep 2024",
        "dir": 1
      },
      {
        "prefix": "Standalone Net Profit ",
        "suffix": " Growth in half year ended Sep 2025 is 95.71% vs -3.55% in Sep 2024",
        "dir": 1
      }
    ],
    "table": {
      "header": [
        "Sep'25",
        "Sep'24",
        "Change(%)"
      ],
      "body": [
        {
          "field": "Net Sales",
          "val1": "34.23",
          "val2": "23.43",
          "chgp": "46.09%",
          "chgp_class": "positive"
        },
        {
          "field": "Operating Profit (PBDIT) excl Other Income",
          "val1": "5.37",
          "val2": "3.31",
          "chgp": "62.24%",
          "chgp_class": "positive"
        },
        {
          "field": "Interest",
          "val1": "1.50",
          "val2": "0.93",
          "chgp": "61.29%",
          "chgp_class": "negative"
        },
        {
          "field": "Exceptional Items",
          "val1": "0.00",
          "val2": "0.00",
          "chgp": "",
          "chgp_class": "neutral"
        },
        {
          "field": "Standalone Net Profit",
          "val1": "3.19",
          "val2": "1.63",
          "chgp": "95.71%",
          "chgp_class": "positive"
        },
        {
          "field": "Operating Profit Margin (Excl OI)",
          "val1": "15.69%",
          "val2": "14.13%",
          "chgp": "1.56%",
          "chgp_class": "positive"
        }
      ]
    }
  },
  {
    "link": "nine-monthly",
    "btn_text": "All Nine Monthly Results",
    "header": "Nine Monthly Results Snapshot (Standalone) - Dec'25",
    "rhs": [
      {
        "prefix": "Net Sales ",
        "suffix": "YoY Growth in nine months ended Dec 2025 is 44.50% vs 19.22% in Dec 2024",
        "dir": 1
      },
      {
        "prefix": "Standalone Net Profit ",
        "suffix": "YoY Growth in nine months ended Dec 2025 is 90.98% vs 1.14% in Dec 2024",
        "dir": 1
      }
    ],
    "table": {
      "header": [
        "Dec'25",
        "Dec'24",
        "Change(%)"
      ],
      "body": [
        {
          "field": "Net Sales",
          "val1": "54.94",
          "val2": "38.02",
          "chgp": "44.50%",
          "chgp_class": "positive"
        },
        {
          "field": "Operating Profit (PBDIT) excl Other Income",
          "val1": "9.06",
          "val2": "5.52",
          "chgp": "64.13%",
          "chgp_class": "positive"
        },
        {
          "field": "Interest",
          "val1": "2.88",
          "val2": "1.45",
          "chgp": "98.62%",
          "chgp_class": "negative"
        },
        {
          "field": "Exceptional Items",
          "val1": "0.00",
          "val2": "0.00",
          "chgp": "",
          "chgp_class": "neutral"
        },
        {
          "field": "Standalone Net Profit",
          "val1": "5.08",
          "val2": "2.66",
          "chgp": "90.98%",
          "chgp_class": "positive"
        },
        {
          "field": "Operating Profit Margin (Excl OI)",
          "val1": "16.49%",
          "val2": "14.52%",
          "chgp": "1.97%",
          "chgp_class": "positive"
        }
      ]
    }
  },
  {
    "link": "annual",
    "btn_text": "All Annual Results",
    "header": "Annual Results Snapshot (Standalone) - Mar'26",
    "rhs": [
      {
        "prefix": "Net Sales ",
        "suffix": "YoY Growth in year ended Mar 2026 is 28.18% vs 44.32% in Mar 2025",
        "dir": -1
      },
      {
        "prefix": "Standalone Net Profit ",
        "suffix": "YoY Growth in year ended Mar 2026 is -70.47% vs 84.08% in Mar 2025",
        "dir": -1
      }
    ],
    "table": {
      "header": [
        "Mar'26",
        "Mar'25",
        "Change(%)"
      ],
      "body": [
        {
          "field": "Net Sales",
          "val1": "80.01",
          "val2": "62.42",
          "chgp": "28.18%",
          "chgp_class": "positive"
        },
        {
          "field": "Operating Profit (PBDIT) excl Other Income",
          "val1": "11.76",
          "val2": "8.63",
          "chgp": "36.27%",
          "chgp_class": "positive"
        },
        {
          "field": "Interest",
          "val1": "3.96",
          "val2": "2.13",
          "chgp": "85.92%",
          "chgp_class": "negative"
        },
        {
          "field": "Exceptional Items",
          "val1": "0.00",
          "val2": "0.00",
          "chgp": "",
          "chgp_class": "neutral"
        },
        {
          "field": "Standalone Net Profit",
          "val1": "1.81",
          "val2": "6.13",
          "chgp": "-70.47%",
          "chgp_class": "negative"
        },
        {
          "field": "Operating Profit Margin (Excl OI)",
          "val1": "14.70%",
          "val2": "13.83%",
          "chgp": "0.87%",
          "chgp_class": "positive"
        }
      ]
    }
  }
]

Quarterly Results Snapshot (Standalone) - Jun'26 - YoYstock-summary

Jun'26
Jun'25
Change(%)
Net Sales
29.46
15.83
86.10%
Operating Profit (PBDIT) excl Other Income
4.06
2.63
54.37%
Interest
0.86
0.68
26.47%
Exceptional Items
0.00
0.00
Standalone Net Profit
1.97
1.46
34.93%
Operating Profit Margin (Excl OI)
13.78%
16.61%
-2.83%
Values in Rs Cr.
Direction Arrows
Net Sales

YoY Growth in quarter ended Jun 2026 is 86.10% vs 45.10% in Jun 2025

Direction Arrows
Standalone Net Profit

YoY Growth in quarter ended Jun 2026 is 34.93% vs 50.52% in Jun 2025

Half Yearly Results Snapshot (Standalone) - Sep'25stock-summary

Sep'25
Sep'24
Change(%)
Net Sales
34.23
23.43
46.09%
Operating Profit (PBDIT) excl Other Income
5.37
3.31
62.24%
Interest
1.50
0.93
61.29%
Exceptional Items
0.00
0.00
Standalone Net Profit
3.19
1.63
95.71%
Operating Profit Margin (Excl OI)
15.69%
14.13%
1.56%
Values in Rs Cr.
Direction Arrows
Net Sales

Growth in half year ended Sep 2025 is 46.09% vs 7.87% in Sep 2024

Direction Arrows
Standalone Net Profit

Growth in half year ended Sep 2025 is 95.71% vs -3.55% in Sep 2024

Nine Monthly Results Snapshot (Standalone) - Dec'25stock-summary

Dec'25
Dec'24
Change(%)
Net Sales
54.94
38.02
44.50%
Operating Profit (PBDIT) excl Other Income
9.06
5.52
64.13%
Interest
2.88
1.45
98.62%
Exceptional Items
0.00
0.00
Standalone Net Profit
5.08
2.66
90.98%
Operating Profit Margin (Excl OI)
16.49%
14.52%
1.97%
Values in Rs Cr.
Direction Arrows
Net Sales

YoY Growth in nine months ended Dec 2025 is 44.50% vs 19.22% in Dec 2024

Direction Arrows
Standalone Net Profit

YoY Growth in nine months ended Dec 2025 is 90.98% vs 1.14% in Dec 2024

Annual Results Snapshot (Standalone) - Mar'26stock-summary

Mar'26
Mar'25
Change(%)
Net Sales
80.01
62.42
28.18%
Operating Profit (PBDIT) excl Other Income
11.76
8.63
36.27%
Interest
3.96
2.13
85.92%
Exceptional Items
0.00
0.00
Standalone Net Profit
1.81
6.13
-70.47%
Operating Profit Margin (Excl OI)
14.70%
13.83%
0.87%
Values in Rs Cr.
Direction Arrows
Net Sales

YoY Growth in year ended Mar 2026 is 28.18% vs 44.32% in Mar 2025

Direction Arrows
Standalone Net Profit

YoY Growth in year ended Mar 2026 is -70.47% vs 84.08% in Mar 2025

stock-summaryCompany CV
About Raaj Medisafe India Ltd stock-summary
stock-summary
Raaj Medisafe India Ltd
Micro Cap
Packaging
Raaj Medisafe India Limited, formerly known Manoj Surgical Industries Limited, incorporated in September, 1985, was later on changed from Manoj Surgical Industries Limited to Raaj Medisafe India Limited in July, 2008. The Company is engaged in the business of manufacturing Medical Disposable Devices in Dhar District of Madhya Pradesh. The manufacturing plant at Pithampur is a modern plant conforming to cGMP requirements.
Company Coordinates stock-summary
Company Details
106 Sector III, Industrial Area Pithampur Dhar Madhya Pradesh : 454774
stock-summary
Tel: 91-7292-403192
stock-summary
info@medisafeindia.com
Registrar Details
Ankit Consultancy Pvt Ltd, Plot No 60, Electronic Complex, Pardeshipura, Indore