
Compare Raaj Medisafe with Similar Stocks
Dashboard
Low ability to service debt as the company has a high Debt to EBITDA ratio of 5.45 times
- Low ability to service debt as the company has a high Debt to EBITDA ratio of 5.45 times
Healthy long term growth as Net Sales has grown by an annual rate of 41.21% and Operating profit at 58.71%
Flat results in Mar 26
With ROCE of 9.9, it has a Very Attractive valuation with a 1.8 Enterprise value to Capital Employed
Majority shareholders : Promoters
Underperformed the market in the last 1 year
Total Returns (Price + Dividend) 
Raaj Medisafe for the last several years.
Risk Adjusted Returns v/s
Returns Beta

News

Raaj Medisafe India Ltd is Rated Hold
Raaj Medisafe India Ltd is rated 'Hold' by MarketsMOJO, with this rating last updated on 26 May 2026. However, the analysis and financial metrics presented here reflect the stock's current position as of 16 June 2026, providing investors with the latest insights into its performance and outlook.
Read full news article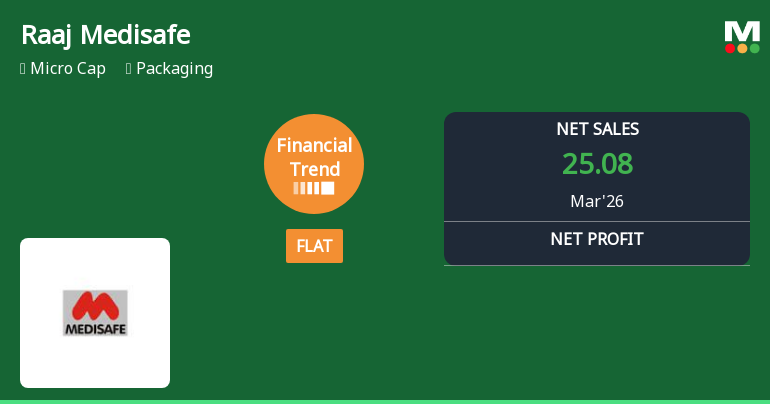
Raaj Medisafe India Ltd Reports Flat Quarterly Performance Amid Margin Pressure
Raaj Medisafe India Ltd, a micro-cap player in the packaging sector, has reported a flat financial performance for the quarter ended March 2026, signalling a notable shift from its previously positive growth trajectory. Despite achieving its highest quarterly net sales to date, the company faced significant margin contraction and a sharp decline in profitability, prompting a downgrade in its Mojo Grade from Buy to Hold.
Read full news article
Raaj Medisafe India Ltd Downgraded to Hold Amid Mixed Technical and Financial Signals
Raaj Medisafe India Ltd, a micro-cap player in the packaging sector, has seen its investment rating downgraded from Buy to Hold as of 26 May 2026. This adjustment reflects a nuanced assessment across four key parameters: quality, valuation, financial trend, and technical indicators. Despite robust long-term growth and improving profitability, recent technical signals and valuation considerations have prompted a more cautious stance from analysts.
Read full news article Announcements
Closure of Trading Window
19-Jun-2026 | Source : BSETrading window shall remain closed for trading in shares of the Company for Promoters/Directors/Officers/designated employees and their immediate relatives with effect from July 1 2026 till 48 Hours from the declaration of Unaudited Financial Results for the quarter ending on June 30 2026
Announcement under Regulation 30 (LODR)-Newspaper Publication
01-Jun-2026 | Source : BSEWe attach herewith newspaper cuttings related to publication of audited results of the Company for the quarter/year ended March 31 2026 published in Free Press and Chautha Sansar edition dated 31.05.2026.
Results- Financial Results For Mar 31 2026
29-May-2026 | Source : BSEWe attach herewith the following: a. Declaration of unmodified opinion b. Audited Financial Results for he quarter/year ended March 31 2026 Declaration of unmodified opinion Auditors Report Statement of Assets and Liabilities as at that date Cashflow statement for the year ended on that date. Segment reporting for the quarter/year ended on that date.
Corporate Actions

No Upcoming Board Meetings

No Dividend history available

No Splits history available

No Bonus history available

No Rights history available
Quality key factors
Valuation key factors
Technicals key factors
 Technical Indicator Scale: Bearish, Mildly Bearish, Sideways, Mildly Bullish, Bullish Turned
 Shareholding Snapshot : Mar 2026
Shareholding Compare (%holding)
Promoters
None
Held by 0 Schemes
Held by 0 FIIs
Sushen Remedies Private Limited (19.24%)
Seema Patel (3.32%)
23.1%
Quarterly Results Snapshot (Standalone) - Mar'26 - YoY

YoY Growth in quarter ended Mar 2026 is 2.79% vs 114.79% in Mar 2025
YoY Growth in quarter ended Mar 2026 is -192.82% vs 397.14% in Mar 2025
Half Yearly Results Snapshot (Standalone) - Sep'25

Growth in half year ended Sep 2025 is 46.09% vs 7.87% in Sep 2024
Growth in half year ended Sep 2025 is 95.71% vs -3.55% in Sep 2024
Nine Monthly Results Snapshot (Standalone) - Dec'25
YoY Growth in nine months ended Dec 2025 is 44.50% vs 19.22% in Dec 2024
YoY Growth in nine months ended Dec 2025 is 90.98% vs 1.14% in Dec 2024
Annual Results Snapshot (Standalone) - Mar'26
YoY Growth in year ended Mar 2026 is 28.18% vs 44.32% in Mar 2025
YoY Growth in year ended Mar 2026 is -70.47% vs 84.08% in Mar 2025
About Raaj Medisafe India Ltd

Company Coordinates


