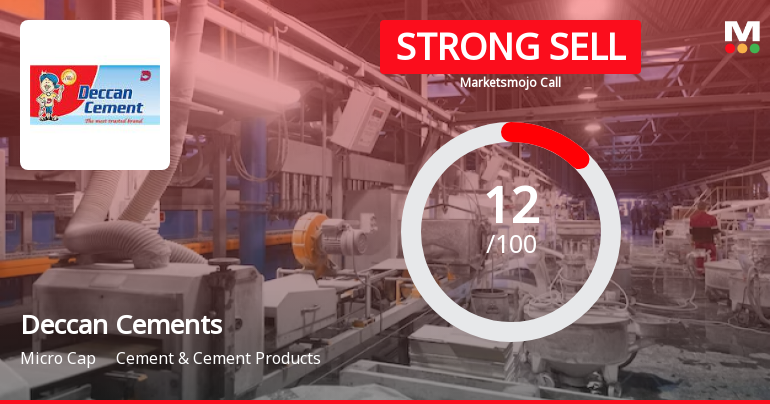
Deccan Cements

  • Market Cap: Micro Cap
  • Industry: Cement & Cement Products
  • ISIN: INE583C01021
  • NSEID: DECCANCE
  • BSEID: 502137
INR
548.45
4.15 (0.76%)
BSENSE

Aug 14, 04:01 PM

BSE+NSE Vol: 7.28 k

  • Price Points
  • Score
  • Mojo Parameters
  • Total Return
  • News and Corporate Actions
  • Key factors
  • Shareholding
  • Financials
  • CompanyCV
stock-summaryPrice Point
High/Low

1Day

52 Week

Valuation
Technical
Day's Volume

CASH

7.28 k (-75.71%) Volume

Shareholding (Jun 2026)

FII

14.65%

Held by 8 FIIs

DII

0.86%

Held by 0 DIIs

Promoter

56.25%

Why is Deccan Cements Ltd. falling/rising?

15-Aug-2026

As of 14-Aug, Deccan Cements Ltd. is seeing a slight stock price increase to 548.45, but it has significantly underperformed over the year with a 26.34% decline year-to-date and a 47.74% drop over the past year. Despite today's minor rise, the stock remains close to its 52-week low and continues to trade below key moving averages, indicating ongoing challenges.

As of 14-Aug, Deccan Cements Ltd. is experiencing a slight rise in its stock price, currently at 548.45, with a change of 4.15 (0.76%) upward. This increase comes after two consecutive days of decline, indicating a potential trend reversal. Despite this positive movement today, the stock has been underperforming over various time frames, with a year-to-date decline of 26.34% and a one-year drop of 47.74%. <BR><BR>The stock is currently trading 4.09% away from its 52-week low, suggesting it is still close to a significant low point. Additionally, the stock has been trading below its moving averages across multiple time frames, including the 5-day, 20-day, 50-day, 100-day, and 200-day averages, which typically indicates a bearish trend. <BR><BR>Investor participation has also decreased, with delivery volume dropping by 41.47% compared to the 5-day average, reflecting a lack of confidence among investors. Despite outperforming its sector by 1.35% today, the overall performance metrics indicate that the stock is still facing significant challenges. Thus, while there is a minor rise today, the broader context suggests ongoing difficulties for Deccan Cements Ltd.

View full answer

Should I buy, sell or hold Deccan Cements Ltd.?

14-Aug-2026

Who are in the management team of Deccan Cements?

14-Aug-2026

The management team of Deccan Cements includes P Parvathi (Chairperson & Managing Director), Umesh Shrivastava, J Narayanamurthy, K P Singh, S A Dave, Mahpara Ali (all Non-Executive & Independent Directors), Ramamurthy Gopalakrishnan (Non-Executive & Non-Independent Director), Bikram Keshari Prusty (Company Secretary & Compliance Officer), and Shonti Venkateswarlu (Director of Works).

The management team of Deccan Cements includes the following members:<BR><BR>1. **P Parvathi** - Chairperson & Managing Director<BR>2. **Umesh Shrivastava** - Non-Executive & Independent Director<BR>3. **J Narayanamurthy** - Non-Executive & Independent Director<BR>4. **K P Singh** - Non-Executive & Independent Director<BR>5. **S A Dave** - Non-Executive & Independent Director<BR>6. **Ramamurthy Gopalakrishnan** - Non-Executive & Non-Independent Director<BR>7. **Bikram Keshari Prusty** - Company Secretary & Compliance Officer<BR>8. **Shonti Venkateswarlu** - Director (Works)<BR>9. **Mahpara Ali** - Non-Executive & Independent Director<BR><BR>If you need more specific details about any of these individuals or their roles, feel free to ask!

View full answer

What does Deccan Cements do?

14-Aug-2026

Deccan Cements Ltd. manufactures and sells cement products and is classified as a Micro Cap company. As of June 2026, it reported net sales of 219 Cr and a net loss of 3 Cr, with a market cap of INR 759 Cr.

Overview:<BR>Deccan Cements Ltd. is engaged in the manufacture and sale of cement products and operates within the Cement & Cement Products industry, classified as a Micro Cap company.<BR><BR>History:<BR>Incorporated in July 1979, Deccan Cements Ltd. has been operational for several decades. The company began commercial production at its first mini cement plant utilizing rotary kiln technology in October 1992. The latest quarterly results reported are for June 2026, showing net sales and profit figures.<BR><BR>Financial Snapshot:<BR>Most recent Net Sales: 219 Cr (Quarterly Results - Jun 2026) <BR>Most recent Net Profit: -3 Cr (Quarterly Results - Jun 2026) <BR>Market-cap value: INR 759 Cr (Micro Cap)<BR><BR>Key Metrics:<BR>P/E: N/A <BR>Industry P/E: 35 <BR>Dividend Yield: 0.11% <BR>Debt-Equity: 0.85 <BR>Return on Equity: 2.11% <BR>Price to Book: 1.01<BR><BR>Contact Details:<BR>Address: Deccan Chambers 6-3-666/B, 3rd Floor Somajiguda Hyderabad Telangana : 500082 <BR>Tel: 91-040-23310168 <BR>Email: info@deccancements.com <BR>Website: http://www.deccancements.com

View full answer

Who are the peers of the Deccan Cements?

14-Aug-2026

Deccan Cements' peers include Sagar Cements, KCP, Sh. Digvijay Cem, Visaka Industrie, NCL Industries, Saurashtra Cem., BIGBLOC Const., Shiva Cement, and Andhra Cements. Visaka Industrie has the highest 1-year return at 14.01%, while Deccan Cements has the lowest at -49.02%.

Peers: The peers of Deccan Cements are Sagar Cements, KCP, Sh. Digvijay Cem, Visaka Industrie, NCL Industries, Saurashtra Cem., BIGBLOC Const., Shiva Cement, and Andhra Cements.<BR><BR>Quality Snapshot: Below Average management risk is observed at Sagar Cements and Andhra Cements, while Average management risk is found at KCP, Sh. Digvijay Cem, Visaka Industrie, NCL Industries, Saurashtra Cem., and BIGBLOC Const., and the rest. Growth is below average across all peers, with Average growth at KCP, Sh. Digvijay Cem, Visaka Industrie, NCL Industries, Saurashtra Cem., and BIGBLOC Const., and the rest. Capital Structure is Excellent at KCP, Good at Sh. Digvijay Cem, NCL Industries, and Saurashtra Cem., and Below Average at Sagar Cements, Visaka Industrie, Deccan Cements, BIGBLOC Const., and Andhra Cements.<BR><BR>Return Snapshot: The peer with the highest 1-year return is Visaka Industrie at 14.01%, while the peer with the lowest is Deccan Cements at -49.02%. Deccan Cements' 1-year return is significantly lower than all its peers. Additionally, the six-month return is negative for Sagar Cements, Deccan Cements, NCL Industries, BIGBLOC Const., and Andhra Cements.

View full answer

How big is Deccan Cements?

14-Aug-2026

As of 14th August, Deccan Cements Ltd. has a market capitalization of 771.18 Cr and reported net sales of 704.39 Cr and a net profit of 10.39 Cr over the latest four quarters.

As of 14th August, <BR><BR>Market Cap: Deccan Cements Ltd. has a market capitalization of 771.18 Cr and is classified as a Micro Cap.<BR><BR>Recent Quarterly Performance: The sum of Net Sales for the latest 4 quarters is 704.39 Cr, while the sum of Net Profit for the same period is 10.39 Cr.<BR><BR>Balance Sheet Snapshot: The reporting period for the balance sheet is March 2025. Shareholder's Funds are valued at 722.43 Cr, and Total Assets amount to 1,625.39 Cr.

View full answer

Are Deccan Cements Ltd. latest results good or bad?

12-Aug-2026

Deccan Cements Ltd.'s latest Q4 FY26 results show strong revenue growth of 79.86% to ₹213.89 crores, but net profit fell by 40.63% to ₹4.72 crores, raising concerns about profitability and financial sustainability due to increased debt and declining margins. Overall, the outlook appears concerning despite the revenue increase.

Deccan Cements Ltd.'s latest results for Q4 FY26 indicate a mixed performance, but overall, the outlook appears concerning. While the company achieved a significant revenue growth of 79.86% year-on-year, reaching ₹213.89 crores, this growth was accompanied by a sharp decline in net profit, which fell by 40.63% to ₹4.72 crores. <BR><BR>The operating margin also contracted to 8.05%, down from 11.03% a year earlier, highlighting challenges in maintaining profitability despite increased sales. Additionally, interest costs surged to ₹15.04 crores, the highest ever for the company, which has raised concerns about its financial sustainability. The interest coverage ratio dropped to just 1.14 times, indicating that operating profit barely covers interest obligations.<BR><BR>Overall, while revenue growth is a positive sign, the significant drop in profitability, rising debt burden, and deteriorating financial metrics suggest that the company is facing serious operational challenges. Investors are understandably skeptical, as reflected in the stock's performance, which has been under pressure and is trading significantly below its 52-week high.

View full answer

When is the next results date for Deccan Cements Ltd.?

05-Aug-2026

The next results date for Deccan Cements Ltd. is 12 August 2026.

The next results date for Deccan Cements Ltd. is scheduled for 12 August 2026.

View full answer

Is Deccan Cements technically bullish or bearish?

03-Dec-2025

As of December 2, 2025, Deccan Cements is in a mildly bearish trend, indicated by bearish MACD and Bollinger Bands on weekly and monthly charts, despite a mildly bullish daily moving average signal.

As of 2 December 2025, the technical trend has changed from sideways to mildly bearish. The current stance for Deccan Cements is mildly bearish. Key indicators driving this include a bearish MACD on both the weekly and monthly time frames, bearish Bollinger Bands, and a mildly bearish KST on the weekly chart. The moving averages show a mildly bullish signal on the daily time frame, but this is overshadowed by the overall bearish sentiment in the weekly and monthly indicators. The Dow Theory also supports a mildly bearish outlook on both weekly and monthly time frames.

View full answer

How has been the historical performance of Deccan Cements?

02-Dec-2025

Deccan Cements reported an operating income of 526.98 crore for the fiscal year ending March 2025, with a profit after tax of 7.52 crore and an EPS of 5.37. The company has significant leverage, with total debt of 714.02 crore against total assets of 1,625.39 crore, and negative cash flow from operating activities at -37.00 crore.

Answer:<BR>The historical performance of Deccan Cements for the year ending March 2025 shows a total operating income of 526.98 crore, with a total expenditure (excluding depreciation) of 491.60 crore, resulting in an operating profit (PBDIT) of 51.58 crore. After accounting for interest expenses of 12.75 crore and depreciation of 28.08 crore, the profit before tax stands at 10.74 crore, leading to a profit after tax of 7.52 crore. The earnings per share (EPS) is reported at 5.37, with a profit after tax margin of 1.43%. The company has a total debt of 714.02 crore against total assets of 1,625.39 crore, indicating a significant leverage position.<BR><BR>Breakdown:<BR>Deccan Cements reported a total operating income of 526.98 crore for the fiscal year ending March 2025, with expenditures primarily driven by power costs of 214.32 crore and manufacturing expenses of 97.60 crore. The operating profit, excluding other income, was 35.38 crore, while the total operating profit including other income reached 51.58 crore. After deducting interest and depreciation, the profit before tax was 10.74 crore, resulting in a profit after tax of 7.52 crore. The company’s total liabilities amounted to 1,625.39 crore, with total debt at 714.02 crore, reflecting a leveraged financial structure. The cash flow from operating activities was negative at -37.00 crore, contributing to a net cash outflow of 87.00 crore, ending the period with cash and cash equivalents of 142.00 crore.

View full answer

Is Deccan Cements overvalued or undervalued?

25-Nov-2025

As of November 24, 2025, Deccan Cements is considered an attractive investment due to its undervalued status, with a PE ratio of 33.35, favorable comparisons to peers like UltraTech Cement and Shree Cement, and a strong 37.79% return over the past year, significantly outperforming the Sensex.

As of 24 November 2025, the valuation grade for Deccan Cements has moved from fair to attractive, indicating a positive shift in its perceived value. The company is currently considered undervalued based on its financial metrics. Key ratios include a PE ratio of 33.35, an EV to EBITDA of 24.87, and a PEG ratio of 1.67, which suggest that the stock is trading at a reasonable valuation compared to its growth prospects.<BR><BR>In comparison to its peers, Deccan Cements shows a more favorable valuation than UltraTech Cement, which has a PE ratio of 46.54, and Shree Cement, with a PE ratio of 55.64. Other peers like Grasim Industries also present attractive valuations with a PE of 41.93. Notably, Deccan Cements has outperformed the Sensex over the past year, with a return of 37.79% compared to the Sensex's 7.31%, reinforcing its attractiveness as an investment.

View full answer

Who are the top shareholders of the Deccan Cements?

17-Jul-2025

The top shareholders of Deccan Cements include Melvillie Finvest Private Limited with 34.76%, 14 Foreign Institutional Investors holding 9.9%, and individual investors owning 19.49%, among others. Vistra ITCL (India) Limited is the largest public shareholder at 3.5%.

The top shareholders of Deccan Cements include a mix of promoters, institutional investors, and individual shareholders. The majority of the shares are held by promoters, with Melvillie Finvest Private Limited being the largest shareholder at 34.76%. <BR><BR>In terms of institutional holdings, 14 Foreign Institutional Investors (FIIs) collectively hold 9.9% of the shares, while mutual funds have a minor stake through 4 schemes, accounting for 0.06%. The highest public shareholder is Vistra ITCL (India) Limited, which holds 3.5%. Additionally, individual investors own 19.49% of the company.

View full answer

Has Deccan Cements declared dividend?

06-Jun-2025

Deccan Cements Ltd. has declared a 60% dividend, amounting to ₹3 per share, with an ex-date of September 20, 2024. The company has shown strong total returns across various periods, particularly a 208.48% total return over the last 5 years.

Deccan Cements Ltd. has declared a 60% dividend.<BR><BR>Dividend Details:<BR>- Percentage announced: 60%<BR>- Amount per share: 3<BR>- Ex-date: 20 Sep 24<BR><BR>Dividend Yield: 0.42%.<BR><BR>Total Returns by Period:<BR>In the last 6 months, the price return was 14.79%, with no dividend return, resulting in a total return of 14.79%.<BR><BR>Over the past year, the price return was 19.41%, with a dividend return of 0.46%, leading to a total return of 19.87%.<BR><BR>In the 2-year period, the price return was 57.04%, with a dividend return of 1.31%, culminating in a total return of 58.35%.<BR><BR>For the 3-year period, the price return was 49.93%, with a dividend return of 2.69%, resulting in a total return of 52.62%.<BR><BR>In the last 4 years, the price return was 40.62%, with a dividend return of 2.82%, leading to a total return of 43.44%.<BR><BR>Over the 5-year period, the price return was 201.87%, with a dividend return of 6.61%, culminating in a total return of 208.48%.<BR><BR>Overall, Deccan Cements has declared a significant dividend while also showing strong total returns across multiple periods, particularly impressive over the long term. The combination of price appreciation and dividends indicates a positive performance for investors.

View full answer
iScoreScore
Click here to find our call on this stock
Strong Sell
Sell
Hold
Buy
Strong Buy

Dashboard

1

Weak Long Term Fundamental Strength with a -33.88% CAGR growth in Operating Profits over the last 5 years

  • Low ability to service debt as the company has a high Debt to EBITDA ratio of 10.87 times
  • The company has been able to generate a Return on Equity (avg) of 2.10% signifying low profitability per unit of shareholders funds
2

The company has declared Negative results for the last 3 consecutive quarters

3

Despite the size of the company, domestic mutual funds hold only 0.14% of the company

stock-summaryMojo Parameters

Mojo Parameters

Loading Valuation Snapshot...

Stock DNA

stock-summary
Industry

Cement & Cement Products

stock-summary
Market cap

INR 762 Cr (Micro Cap)

stock-summary
P/E

NA (Loss Making)

stock-summary
Industry P/E

34

stock-summary
Dividend Yield

0.11%

stock-summary
Debt Equity

0.88

stock-summary
Return on Equity

2.10%

stock-summary
Price to Book

1.02

Revenue and Profits:
Net Sales:
219 Cr
(Quarterly Results - Jun 2026)
Net Profit:
-3 Cr
stock-summaryTotal Returns
Total Returns (Price + Dividend) stock-summary
Dividend Yield (0.11%)
TimePeriod
Price Return
Dividend Return
Total Return
3 Months
-13.63%
0.08%
-13.55%
6 Months
-21.04%
0.07%
-20.97%
1 Year
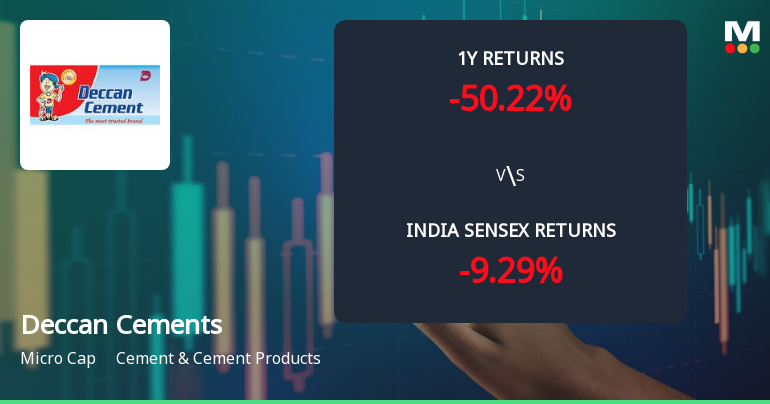
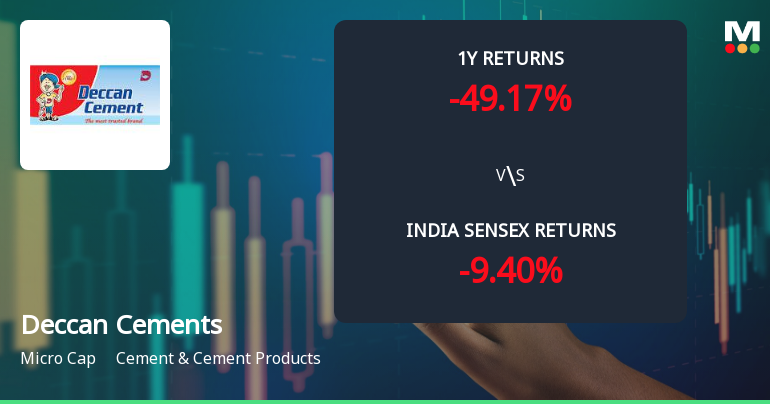
-47.74%
0.10%
-47.64%
2 Years
-13.85%
0.62%
-13.23%
3 Years
4.48%
1.50%
5.98%
4 Years
4.66%
2.49%
7.15%
5 Years
-30.7%
1.73%
-28.97%

Latest dividend: 0.6 per share ex-dividend date: Sep-16-2025

Risk Adjusted Returns v/s stock-summary
Returns Beta
Icon
Beta has not been calculated since enough price history is not available
stock-summaryNews & Corporate Actions

News

Deccan Cements Declines 5.91%: Four Key Factors Driving the Week’s Downtrend

Key Events This Week

10 Aug: Stock hits 52-week low at Rs.527.3

11 Aug: Technical indicators worsen; Mojo Grade downgraded to Strong Sell

12 Aug: New 52-week low of Rs.526 amid continued downtrend

14 Aug: Valuation shifts signal deteriorating price attractiveness

Announcements stock-summary

Announcement under Regulation 30 (LODR)-Newspaper Publication

13-Aug-2026 | Source : BSE

Publication of Extract of unaudited quarterly financial results for Q1 of FY 2026-27 on newspaper

Announcement under Regulation 30 (LODR)-Credit Rating

12-Aug-2026 | Source : BSE

Credit Rating by CARE Ratings Limited

Board Meeting Outcome for Outcome Of Board Meeting Held On 12Th August 2026

12-Aug-2026 | Source : BSE

Outcome of Board Meeting

Corporate Actions stock-summary

stock-summary
BOARD MEETING

No Upcoming Board Meetings

stock-summary
DIVIDEND

Deccan Cements Ltd. has declared 10% dividend, ex-date: 22 Sep 26

stock-summary
SPLITS

Deccan Cements Ltd. has announced 5:10 stock split, ex-date: 11 Sep 17

stock-summary
BONUS

No Bonus history available

stock-summary
RIGHTS

No Rights history available

stock-summaryKey Factors

Quality key factors stock-summary

Factor
Value
Sales Growth (5y)
-3.56%
EBIT Growth (5y)
-33.88%
EBIT to Interest (avg)
1.18
Debt to EBITDA (avg)
5.73
Net Debt to Equity (avg)
0.88
Sales to Capital Employed (avg)
0.75
Tax Ratio
Tax Ratio is Negative%
Dividend Payout Ratio
11.16%
Pledged Shares
0
Institutional Holding
15.51%
ROCE (avg)
14.06%
ROE (avg)
2.10%

Valuation key factors

Factor
Value
P/E Ratio
NA (Loss Making)
Industry P/E
34
Price to Book Value
1.02
EV to EBIT
67.70
EV to EBITDA
21.81
EV to Capital Employed
1.01
EV to Sales
2.03
PEG Ratio
NA
Dividend Yield
0.11%
ROCE (Latest)
2.90%
ROE (Latest)
2.10%

Technicals key factors

Indicator
Weekly
Monthly
MACD
Mildly Bullish
Bearish
RSI
No Signal
No Signal
Bollinger Bands
Bearish
Bearish
Moving Averages
Bearish (Daily)
KST
Bearish
Bearish
Dow Theory
Mildly Bearish
Mildly Bearish
OBV
Mildly Bullish
Mildly Bearish
stock-summary Technical Indicator Scale: Bearish, Mildly Bearish, Sideways, Mildly Bullish, Bullish  Turned 
stock-summaryShareholding
Shareholding Snapshot : Jun 2026stock-summary
Shareholding Compare (%holding) stock-summary
Majority shareholders

Promoters

Pledged Promoter Holdings

None

Mutual Funds

Held by 4 Schemes (0.06%)

FIIs

Held by 8 FIIs (14.65%)

Promoter with highest holding

Melvillie Finvest Private Limited (34.76%)

Highest Public shareholder

First Water Fund (6.92%)

Individual Investors Holdings

16.53%

stock-summaryFinancial
[
  {
    "link": "quarterly",
    "btn_text": "All Quarterly Results",
    "header": "Quarterly Results Snapshot (Consolidated) - Jun'26 - YoY",
    "rhs": [
      {
        "prefix": "Net Sales ",
        "suffix": "YoY Growth in quarter ended Jun 2026 is 45.68% vs -12.54% in Jun 2025",
        "dir": 1
      },
      {
        "prefix": "Consolidated Net Profit ",
        "suffix": "YoY Growth in quarter ended Jun 2026 is -118.50% vs 446.26% in Jun 2025",
        "dir": -1
      }
    ],
    "table": {
      "header": [
        "Jun'26",
        "Jun'25",
        "Change(%)"
      ],
      "body": [
        {
          "field": "Net Sales",
          "val1": "219.34",
          "val2": "150.56",
          "chgp": "45.68%",
          "chgp_class": "positive"
        },
        {
          "field": "Operating Profit (PBDIT) excl Other Income",
          "val1": "16.85",
          "val2": "27.88",
          "chgp": "-39.56%",
          "chgp_class": "negative"
        },
        {
          "field": "Interest",
          "val1": "15.67",
          "val2": "3.47",
          "chgp": "351.59%",
          "chgp_class": "negative"
        },
        {
          "field": "Exceptional Items",
          "val1": "2.27",
          "val2": "0.00",
          "chgp": "",
          "chgp_class": "neutral"
        },
        {
          "field": "Consolidate Net Profit",
          "val1": "-2.84",
          "val2": "15.35",
          "chgp": "-118.50%",
          "chgp_class": "negative"
        },
        {
          "field": "Operating Profit Margin (Excl OI)",
          "val1": "7.68%",
          "val2": "18.52%",
          "chgp": "-10.84%",
          "chgp_class": "negative"
        }
      ]
    }
  },
  {
    "link": "half-yearly",
    "btn_text": "All Half Yearly Results",
    "header": "Half Yearly Results Snapshot (Standalone) - Sep'25",
    "rhs": [
      {
        "prefix": "Net Sales ",
        "suffix": " Growth in half year ended Sep 2025 is -0.59% vs -18.57% in Sep 2024",
        "dir": 1
      },
      {
        "prefix": "Standalone Net Profit ",
        "suffix": " Growth in half year ended Sep 2025 is 2,085.37% vs -106.52% in Sep 2024",
        "dir": 1
      }
    ],
    "table": {
      "header": [
        "Sep'25",
        "Sep'24",
        "Change(%)"
      ],
      "body": [
        {
          "field": "Net Sales",
          "val1": "290.87",
          "val2": "292.61",
          "chgp": "-0.59%",
          "chgp_class": "negative"
        },
        {
          "field": "Operating Profit (PBDIT) excl Other Income",
          "val1": "48.03",
          "val2": "13.51",
          "chgp": "255.51%",
          "chgp_class": "positive"
        },
        {
          "field": "Interest",
          "val1": "6.73",
          "val2": "6.43",
          "chgp": "4.67%",
          "chgp_class": "negative"
        },
        {
          "field": "Exceptional Items",
          "val1": "0.00",
          "val2": "0.00",
          "chgp": "",
          "chgp_class": "neutral"
        },
        {
          "field": "Standalone Net Profit",
          "val1": "24.42",
          "val2": "-1.23",
          "chgp": "2,085.37%",
          "chgp_class": "positive"
        },
        {
          "field": "Operating Profit Margin (Excl OI)",
          "val1": "16.51%",
          "val2": "4.62%",
          "chgp": "11.89%",
          "chgp_class": "positive"
        }
      ]
    }
  },
  {
    "link": "nine-monthly",
    "btn_text": "All Nine Monthly Results",
    "header": "Nine Monthly Results Snapshot (Standalone) - Dec'25",
    "rhs": [
      {
        "prefix": "Net Sales ",
        "suffix": "YoY Growth in nine months ended Dec 2025 is 3.35% vs -29.18% in Dec 2024",
        "dir": 1
      },
      {
        "prefix": "Standalone Net Profit ",
        "suffix": "YoY Growth in nine months ended Dec 2025 is 5,783.33% vs -101.23% in Dec 2024",
        "dir": 1
      }
    ],
    "table": {
      "header": [
        "Dec'25",
        "Dec'24",
        "Change(%)"
      ],
      "body": [
        {
          "field": "Net Sales",
          "val1": "421.72",
          "val2": "408.06",
          "chgp": "3.35%",
          "chgp_class": "positive"
        },
        {
          "field": "Operating Profit (PBDIT) excl Other Income",
          "val1": "59.41",
          "val2": "22.26",
          "chgp": "166.89%",
          "chgp_class": "positive"
        },
        {
          "field": "Interest",
          "val1": "12.23",
          "val2": "9.94",
          "chgp": "23.04%",
          "chgp_class": "negative"
        },
        {
          "field": "Exceptional Items",
          "val1": "0.00",
          "val2": "0.00",
          "chgp": "",
          "chgp_class": "neutral"
        },
        {
          "field": "Standalone Net Profit",
          "val1": "23.87",
          "val2": "-0.42",
          "chgp": "5,783.33%",
          "chgp_class": "positive"
        },
        {
          "field": "Operating Profit Margin (Excl OI)",
          "val1": "14.09%",
          "val2": "5.46%",
          "chgp": "8.63%",
          "chgp_class": "positive"
        }
      ]
    }
  },
  {
    "link": "annual",
    "btn_text": "All Annual Results",
    "header": "Annual Results Snapshot (Standalone) - Mar'26",
    "rhs": [
      {
        "prefix": "Net Sales ",
        "suffix": "YoY Growth in year ended Mar 2026 is 20.61% vs -34.08% in Mar 2025",
        "dir": 1
      },
      {
        "prefix": "Standalone Net Profit ",
        "suffix": "YoY Growth in year ended Mar 2026 is 279.68% vs -79.79% in Mar 2025",
        "dir": 1
      }
    ],
    "table": {
      "header": [
        "Mar'26",
        "Mar'25",
        "Change(%)"
      ],
      "body": [
        {
          "field": "Net Sales",
          "val1": "635.61",
          "val2": "526.98",
          "chgp": "20.61%",
          "chgp_class": "positive"
        },
        {
          "field": "Operating Profit (PBDIT) excl Other Income",
          "val1": "76.64",
          "val2": "35.39",
          "chgp": "116.56%",
          "chgp_class": "positive"
        },
        {
          "field": "Interest",
          "val1": "27.28",
          "val2": "12.75",
          "chgp": "113.96%",
          "chgp_class": "negative"
        },
        {
          "field": "Exceptional Items",
          "val1": "12.84",
          "val2": "0.00",
          "chgp": "",
          "chgp_class": "neutral"
        },
        {
          "field": "Standalone Net Profit",
          "val1": "28.59",
          "val2": "7.53",
          "chgp": "279.68%",
          "chgp_class": "positive"
        },
        {
          "field": "Operating Profit Margin (Excl OI)",
          "val1": "12.06%",
          "val2": "6.72%",
          "chgp": "5.34%",
          "chgp_class": "positive"
        }
      ]
    }
  }
]

Quarterly Results Snapshot (Consolidated) - Jun'26 - YoYstock-summary

Jun'26
Jun'25
Change(%)
Net Sales
219.34
150.56
45.68%
Operating Profit (PBDIT) excl Other Income
16.85
27.88
-39.56%
Interest
15.67
3.47
351.59%
Exceptional Items
2.27
0.00
Consolidate Net Profit
-2.84
15.35
-118.50%
Operating Profit Margin (Excl OI)
7.68%
18.52%
-10.84%
Values in Rs Cr.
Direction Arrows
Net Sales

YoY Growth in quarter ended Jun 2026 is 45.68% vs -12.54% in Jun 2025

Direction Arrows
Consolidated Net Profit

YoY Growth in quarter ended Jun 2026 is -118.50% vs 446.26% in Jun 2025

Half Yearly Results Snapshot (Standalone) - Sep'25stock-summary

Sep'25
Sep'24
Change(%)
Net Sales
290.87
292.61
-0.59%
Operating Profit (PBDIT) excl Other Income
48.03
13.51
255.51%
Interest
6.73
6.43
4.67%
Exceptional Items
0.00
0.00
Standalone Net Profit
24.42
-1.23
2,085.37%
Operating Profit Margin (Excl OI)
16.51%
4.62%
11.89%
Values in Rs Cr.
Direction Arrows
Net Sales

Growth in half year ended Sep 2025 is -0.59% vs -18.57% in Sep 2024

Direction Arrows
Standalone Net Profit

Growth in half year ended Sep 2025 is 2,085.37% vs -106.52% in Sep 2024

Nine Monthly Results Snapshot (Standalone) - Dec'25stock-summary

Dec'25
Dec'24
Change(%)
Net Sales
421.72
408.06
3.35%
Operating Profit (PBDIT) excl Other Income
59.41
22.26
166.89%
Interest
12.23
9.94
23.04%
Exceptional Items
0.00
0.00
Standalone Net Profit
23.87
-0.42
5,783.33%
Operating Profit Margin (Excl OI)
14.09%
5.46%
8.63%
Values in Rs Cr.
Direction Arrows
Net Sales

YoY Growth in nine months ended Dec 2025 is 3.35% vs -29.18% in Dec 2024

Direction Arrows
Standalone Net Profit

YoY Growth in nine months ended Dec 2025 is 5,783.33% vs -101.23% in Dec 2024

Annual Results Snapshot (Standalone) - Mar'26stock-summary

Mar'26
Mar'25
Change(%)
Net Sales
635.61
526.98
20.61%
Operating Profit (PBDIT) excl Other Income
76.64
35.39
116.56%
Interest
27.28
12.75
113.96%
Exceptional Items
12.84
0.00
Standalone Net Profit
28.59
7.53
279.68%
Operating Profit Margin (Excl OI)
12.06%
6.72%
5.34%
Values in Rs Cr.
Direction Arrows
Net Sales

YoY Growth in year ended Mar 2026 is 20.61% vs -34.08% in Mar 2025

Direction Arrows
Standalone Net Profit

YoY Growth in year ended Mar 2026 is 279.68% vs -79.79% in Mar 2025

stock-summaryCompany CV
About Deccan Cements Ltd. stock-summary
stock-summary
Deccan Cements Ltd.
Micro Cap
Cement & Cement Products
Incorporated in Jul.'79, Deccan Cements Ltd is engaged in manufacture and sale of cement with different product mix including OPC, PPC, SRC and Slag Cement. In the domestic market, it operates through a network of dealers for sale of its products. It is also engaged in the generation of Energy under Non conventional Sources viz., Hydel and Wind Power. The first mini cement plant based on rotary kiln technology started commercial production in Oct.'92.
Company Coordinates stock-summary
Company Details
Deccan Chambers 6-3-666/B, 3rd Floor Somajiguda Hyderabad Telangana : 500082
stock-summary
Tel: 91-040-23310168
stock-summary
info@deccancements.com
Registrar Details
Karvy Computershare Pvt Ltd, Plot No 17-24 , Near Image Hospital,, Reliance Cybervilae,Vithalrao Nagar,, Madhapur, Hyderabad