
Compare Deccan Cements with Similar Stocks
Dashboard
Weak Long Term Fundamental Strength with a -23.12% CAGR growth in Operating Profits over the last 5 years
- The company has been able to generate a Return on Equity (avg) of 6.69% signifying low profitability per unit of shareholders funds
Negative results in Mar 26
Despite the size of the company, domestic mutual funds hold only 0.14% of the company
Below par performance in long term as well as near term
Stock DNA
Cement & Cement Products
INR 814 Cr (Micro Cap)
51.00
34
0.10%
0.85
2.11%
1.11
Total Returns (Price + Dividend) 
Latest dividend: 0.6 per share ex-dividend date: Sep-16-2025
Risk Adjusted Returns v/s
Returns Beta

News
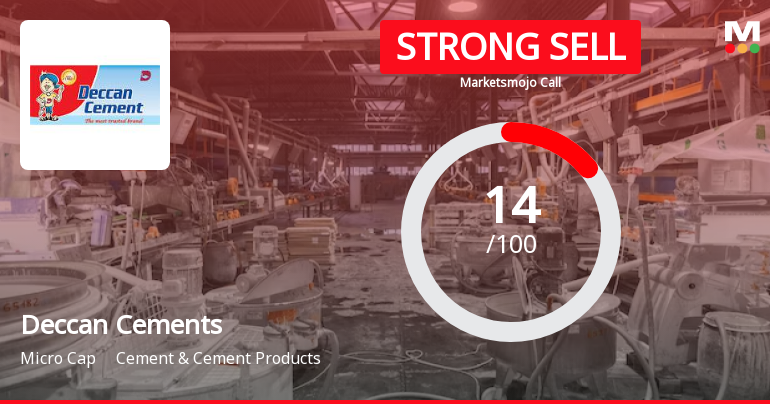
Deccan Cements Ltd. is Rated Strong Sell
Deccan Cements Ltd. is rated Strong Sell by MarketsMOJO, with this rating last updated on 02 June 2026. However, the analysis and financial metrics discussed here reflect the stock’s current position as of 17 July 2026, providing investors with the latest insights into the company’s performance and outlook.
Read full news article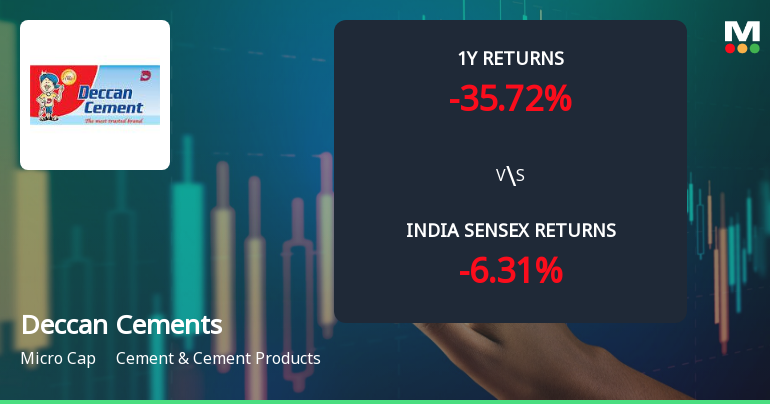
Deccan Cements Ltd. Faces Intensified Downtrend Amid Technical Weakness
Deccan Cements Ltd., a micro-cap player in the Cement & Cement Products sector, has experienced a notable shift in its technical momentum, with key indicators signalling a bearish trend. The stock’s recent downgrade to a Strong Sell rating by MarketsMOJO reflects deteriorating market sentiment amid weak price action and subdued relative strength compared to benchmark indices.
Read full news article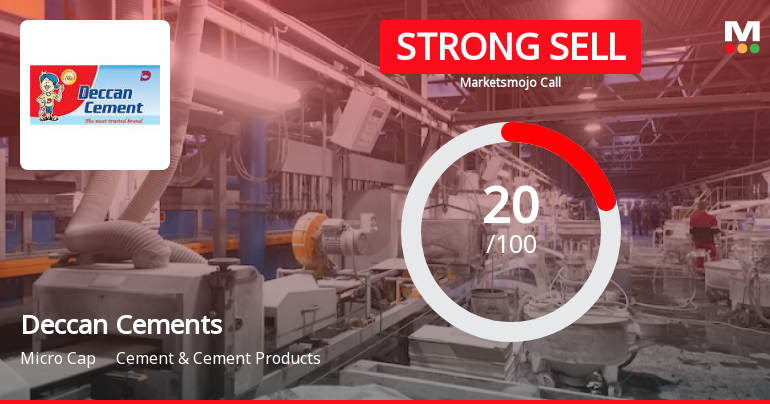
Deccan Cements Ltd. is Rated Strong Sell
Deccan Cements Ltd. is rated Strong Sell by MarketsMOJO, with this rating last updated on 02 June 2026. However, the analysis and financial metrics discussed here reflect the stock’s current position as of 06 July 2026, providing investors with an up-to-date view of the company’s performance and outlook.
Read full news article Announcements
Compliances-Certificate under Reg. 74 (5) of SEBI (DP) Regulations 2018
13-Jul-2026 | Source : BSECompliance Certificate under Regulation 74(5) of the SEBI (DP) Regulations
Announcement under Regulation 30 (LODR)-Credit Rating
08-Jul-2026 | Source : BSECredit Rating by CRISIL
Announcement under Regulation 30 (LODR)-Allotment
25-Jun-2026 | Source : BSEAllotment of Debentures
Corporate Actions

No Upcoming Board Meetings

Deccan Cements Ltd. has declared 12% dividend, ex-date: 16 Sep 25

Deccan Cements Ltd. has announced 5:10 stock split, ex-date: 11 Sep 17

No Bonus history available

No Rights history available
Quality key factors
Valuation key factors
Technicals key factors
 Technical Indicator Scale: Bearish, Mildly Bearish, Sideways, Mildly Bullish, Bullish Turned
 Shareholding Snapshot : Jun 2026
Shareholding Compare (%holding)
Promoters
None
Held by 4 Schemes (0.06%)
Held by 8 FIIs (14.65%)
Melvillie Finvest Private Limited (34.76%)
First Water Fund (6.92%)
16.53%
Quarterly Results Snapshot (Standalone) - Mar'26 - YoY

YoY Growth in quarter ended Mar 2026 is 79.86% vs -46.73% in Mar 2025

YoY Growth in quarter ended Mar 2026 is -40.50% vs 164.12% in Mar 2025
Half Yearly Results Snapshot (Standalone) - Sep'25
Growth in half year ended Sep 2025 is -0.59% vs -18.57% in Sep 2024
Growth in half year ended Sep 2025 is 2,085.37% vs -106.52% in Sep 2024
Nine Monthly Results Snapshot (Standalone) - Dec'25
YoY Growth in nine months ended Dec 2025 is 3.35% vs -29.18% in Dec 2024
YoY Growth in nine months ended Dec 2025 is 5,783.33% vs -101.23% in Dec 2024
Annual Results Snapshot (Standalone) - Mar'26
YoY Growth in year ended Mar 2026 is 20.61% vs -34.08% in Mar 2025
YoY Growth in year ended Mar 2026 is 279.68% vs -79.79% in Mar 2025
About Deccan Cements Ltd.

Company Coordinates


