
Compare TIL with Similar Stocks
Dashboard
High Debt company with Weak Long Term Fundamental Strength
- Poor long term growth as Net Sales has grown by an annual rate of 0.63% and Operating profit at 14.14% over the last 5 years
- High Debt Company with a Debt to Equity ratio (avg) of 3.90 times
- The company has been able to generate a Return on Equity (avg) of 0.69% signifying low profitability per unit of shareholders funds
The company has declared Negative results for the last 4 consecutive quarters
Risky - Negative Operating Profits
Stock DNA
Automobiles
INR 2,038 Cr (Micro Cap)
NA (Loss Making)
35
0.00%
3.25
-22.69%
16.50
Total Returns (Price + Dividend) 
Latest dividend: 1.6386831079999997 per share ex-dividend date: Aug-06-2019
Risk Adjusted Returns v/s
Returns Beta

News

TIL Ltd Surges on Heavy Trading Volume Amid Strong Volatility and Institutional Interest
TIL Ltd, a micro-cap player in the automobile sector, witnessed a remarkable surge in trading activity on 29 Jul 2026, with its stock price rallying 12.07% intraday amid exceptionally high value turnover and robust investor participation. Despite a recent downgrade to a Strong Sell rating by MarketsMOJO, the stock has outperformed its sector and broader market indices, driven by heightened volatility and large order flows.
Read full news article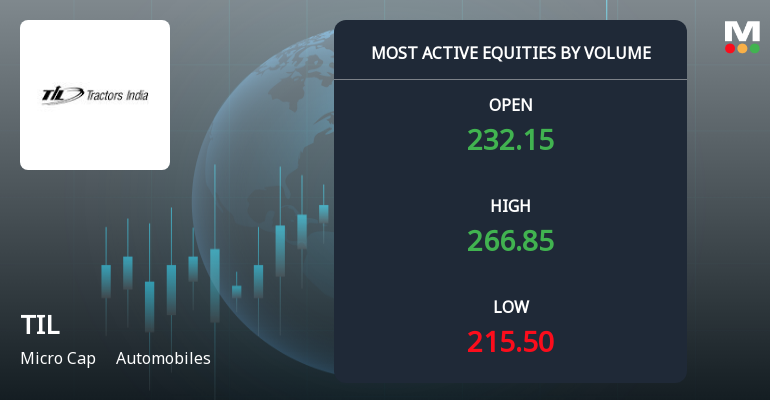
TIL Ltd Surges on Exceptional Volume Amid Strong Market Activity
TIL Ltd, a micro-cap player in the automobile sector, witnessed a remarkable surge in trading volume and price on 29 Jul 2026, outperforming its sector and broader market indices. The stock’s extraordinary volume activity, coupled with a strong mojo downgrade to 'Strong Sell', signals heightened investor interest and volatility, making it a focal point for market participants today.
Read full news article
TIL Ltd is Rated Strong Sell
TIL Ltd is rated Strong Sell by MarketsMOJO, with this rating last updated on 22 September 2025. However, the analysis and financial metrics discussed here reflect the company’s current position as of 28 July 2026, providing investors with an up-to-date view of the stock’s fundamentals, returns, and technical outlook.
Read full news article Announcements
Statement Of Deviation Or Variation In Utilization Of Fund Under Regulation 32 Of SEBI LODR
18-Jul-2026 | Source : BSEletter attached
Intimation Of Sending Of Reminder Letter For Payment Of First & Final Call Money
14-Jul-2026 | Source : BSEletter attached
Announcement under Regulation 30 (LODR)-Allotment
09-Jul-2026 | Source : BSELetter attached
Corporate Actions

No Upcoming Board Meetings

TIL Ltd has declared 17% dividend, ex-date: 06 Aug 19

No Splits history available

No Bonus history available

TIL Ltd has announced 11:64 rights issue, ex-date: 23 Mar 26
Quality key factors
Valuation key factors
Technicals key factors
 Technical Indicator Scale: Bearish, Mildly Bearish, Sideways, Mildly Bullish, Bullish Turned
 Shareholding Snapshot : Jun 2026
Shareholding Compare (%holding)
Promoters
None
Held by 1 Schemes (0.0%)
Held by 9 FIIs (2.62%)
Til Global Private Limited (61.3%)
Girish Gulati Huf (3.68%)
21.49%
Quarterly Results Snapshot (Consolidated) - Mar'26 - YoY

YoY Growth in quarter ended Mar 2026 is 7.21% vs 223.00% in Mar 2025
YoY Growth in quarter ended Mar 2026 is -202.15% vs -94.21% in Mar 2025
Half Yearly Results Snapshot (Consolidated) - Sep'25
Growth in half year ended Sep 2025 is 4.87% vs 474.81% in Sep 2024
Growth in half year ended Sep 2025 is -335.94% vs 83.51% in Sep 2024
Nine Monthly Results Snapshot (Consolidated) - Dec'25
YoY Growth in nine months ended Dec 2025 is 0.30% vs 502.48% in Dec 2024
YoY Growth in nine months ended Dec 2025 is -201.45% vs -108.09% in Dec 2024
Annual Results Snapshot (Consolidated) - Mar'26
YoY Growth in year ended Mar 2026 is 2.53% vs 371.20% in Mar 2025
YoY Growth in year ended Mar 2026 is -1,175.87% vs -98.87% in Mar 2025
About TIL Ltd

Company Coordinates


