
Dashboard
Low ability to service debt as the company has a high Debt to EBITDA ratio of 4.39 times
- Low ability to service debt as the company has a high Debt to EBITDA ratio of 4.39 times
Poor long term growth as Operating profit has grown by an annual rate 2.41% of over the last 5 years
With ROCE of 7.1, it has a Attractive valuation with a 1.3 Enterprise value to Capital Employed
Despite the size of the company, domestic mutual funds hold only 0.58% of the company
Stock DNA
Fertilizers
INR 7,652 Cr (Small Cap)
19.00
24
1.68%
0.78
7.75%
1.47
Total Returns (Price + Dividend) 
Latest dividend: 1.001156069364162 per share ex-dividend date: Feb-20-2026
Risk Adjusted Returns v/s
Returns Beta

News
Rashtriya Chemicals & Fertilizers Ltd. Upgraded to Hold on Technical Improvements and Financial Gains
Rashtriya Chemicals & Fertilizers Ltd. (RCF) has seen its investment rating upgraded from Sell to Hold, reflecting a nuanced improvement across technical indicators, valuation metrics, financial trends, and overall quality. This reassessment comes amid a backdrop of mixed market performance and evolving company fundamentals, signalling cautious optimism among investors and analysts alike.
Read full news article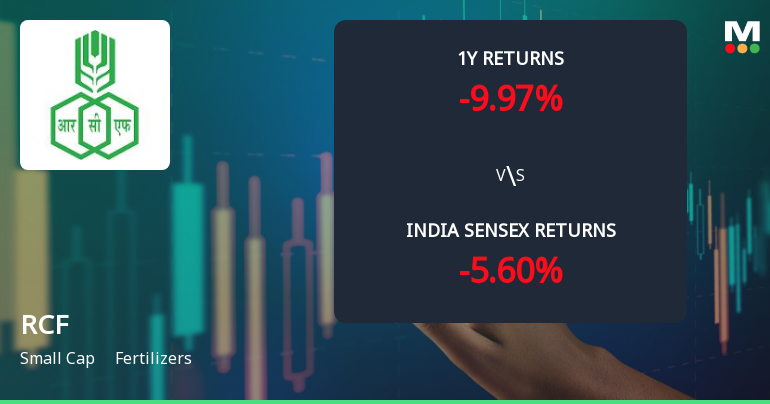
Rashtriya Chemicals & Fertilizers Ltd. Technical Momentum Shifts to Sideways; Hold Rating Affirmed
Rashtriya Chemicals & Fertilizers Ltd. (RCF) has exhibited a notable shift in its technical momentum, moving from a mildly bearish stance to a sideways trend. Recent technical indicators present a complex picture, with weekly signals showing mild bullishness while monthly charts remain cautious. This nuanced technical landscape, combined with a 1.67% day gain and a Mojo Grade upgrade from Sell to Hold, suggests a period of consolidation for the small-cap fertilizer company amid broader market fluctuations.
Read full news article
Rashtriya Chemicals & Fertilizers Ltd. is Rated Hold
Rashtriya Chemicals & Fertilizers Ltd. is rated 'Hold' by MarketsMOJO, with this rating last updated on 19 June 2026. While the rating was revised on that date, the analysis and financial metrics presented here reflect the company’s current position as of 20 June 2026, providing investors with an up-to-date view of the stock’s fundamentals, valuation, financial trends, and technical outlook.
Read full news article Announcements
Compliances-Reg.24(A)-Annual Secretarial Compliance
30-May-2026 | Source : BSEAttached
Intimation Under Regulation 30 Of SEBI (Listing Obligations And Disclosure Requirements) Regulations 2015 - (SEBI LODR)
28-May-2026 | Source : BSEIntimation enclosed herewith
Announcement under Regulation 30 (LODR)-Newspaper Publication
22-May-2026 | Source : BSEIntimation enclosed herewith
Corporate Actions

No Upcoming Board Meetings

Rashtriya Chemicals & Fertilizers Ltd. has declared 10% dividend, ex-date: 20 Feb 26

No Splits history available

No Bonus history available

No Rights history available
Quality key factors
Valuation key factors
Technicals key factors
 Technical Indicator Scale: Bearish, Mildly Bearish, Sideways, Mildly Bullish, Bullish Turned
 Shareholding Snapshot : Mar 2026
Shareholding Compare (%holding)
Promoters
None
Held by 11 Schemes (0.14%)
Held by 92 FIIs (2.6%)
President Of India (75.0%)
None
19.43%
Quarterly Results Snapshot (Consolidated) - Mar'26 - YoY

YoY Growth in quarter ended Mar 2026 is 49.63% vs -3.87% in Mar 2025
YoY Growth in quarter ended Mar 2026 is 157.69% vs -23.92% in Mar 2025
Half Yearly Results Snapshot (Consolidated) - Sep'25

Growth in half year ended Sep 2025 is -0.26% vs 5.95% in Sep 2024
Growth in half year ended Sep 2025 is 78.01% vs -24.46% in Sep 2024
Nine Monthly Results Snapshot (Consolidated) - Dec'25
YoY Growth in nine months ended Dec 2025 is -2.31% vs 0.78% in Dec 2024
YoY Growth in nine months ended Dec 2025 is 41.61% vs 30.72% in Dec 2024
Annual Results Snapshot (Consolidated) - Mar'26
YoY Growth in year ended Mar 2026 is 9.13% vs -0.28% in Mar 2025
YoY Growth in year ended Mar 2026 is 76.30% vs 7.62% in Mar 2025
About Rashtriya Chemicals & Fertilizers Ltd.

Company Coordinates


