
Compare EID Parry with Similar Stocks
Dashboard
Company has a Debt to Equity ratio (avg) of 0.01 times
The company has declared Positive results for the last 4 consecutive quarters
With ROE of 12, it has a Fair valuation with a 1.6 Price to Book Value
High Institutional Holdings at 28.95%
Underperformed the market in the last 1 year
With its market cap of Rs 13,952 cr, it is the biggest company in the sector and constitutes 19.50% of the entire sector
Stock DNA
Fertilizers
INR 13,651 Cr (Small Cap)
13.00
21
0.00%
0.02
11.95%
1.59
Total Returns (Price + Dividend) 
Latest dividend: 4.0232653061224495 per share ex-dividend date: Nov-21-2023
Risk Adjusted Returns v/s
Returns Beta

News
EID Parry (India) Ltd Upgraded to Hold on Improved Technicals and Financial Trends
EID Parry (India) Ltd has seen its investment rating upgraded from Sell to Hold, reflecting a nuanced improvement across technical indicators, financial performance, valuation metrics, and overall quality. This reassessment comes amid a backdrop of mixed market returns and evolving sector dynamics, signalling cautious optimism for investors in this small-cap fertilizer company.
Read full news article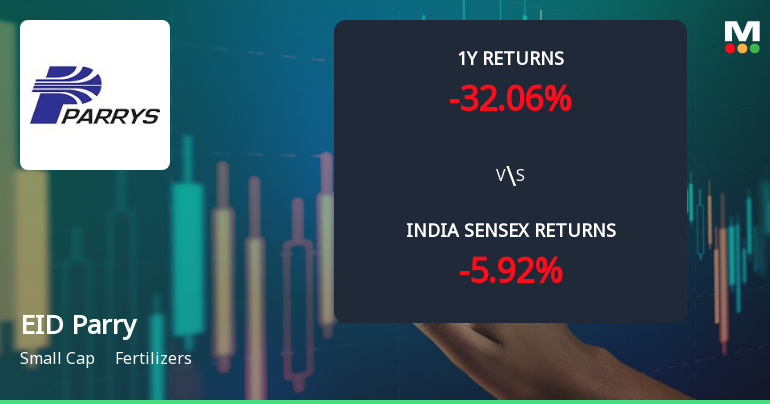
EID Parry (India) Ltd Technical Momentum Shifts Amid Mixed Market Signals
EID Parry (India) Ltd has exhibited a notable shift in its technical momentum, moving from a bearish stance to a mildly bearish outlook, supported by a blend of bullish and bearish signals across key technical indicators. Despite a 3.41% gain on 14 Jul 2026, the stock’s mixed technical profile and recent upgrades suggest cautious optimism for investors navigating the fertilizers sector.
Read full news article
EID Parry (India) Ltd is Rated Sell by MarketsMOJO
EID Parry (India) Ltd is rated 'Sell' by MarketsMOJO, with this rating last updated on 01 June 2026. However, the analysis and financial metrics discussed here reflect the stock's current position as of 05 July 2026, providing investors with the latest insights into the company’s performance and outlook.
Read full news article Announcements
Announcement under Regulation 30 (LODR)-Newspaper Publication
07-Jul-2026 | Source : BSECopy of Newspaper Publication
Compliances-Certificate under Reg. 74 (5) of SEBI (DP) Regulations 2018
06-Jul-2026 | Source : BSECertificate under Reg. 74(5) of SEBI (DP) Regulations 2018
Closure of Trading Window
23-Jun-2026 | Source : BSEClosure of Trading Window
Corporate Actions

No Upcoming Board Meetings

EID Parry (India) Ltd has declared 400% dividend, ex-date: 21 Nov 23

EID Parry (India) Ltd has announced 1:2 stock split, ex-date: 23 Dec 10

No Bonus history available

No Rights history available
Quality key factors
Valuation key factors
Technicals key factors
 Technical Indicator Scale: Bearish, Mildly Bearish, Sideways, Mildly Bullish, Bullish Turned
 Shareholding Snapshot : Mar 2026
Shareholding Compare (%holding)
Promoters
0.0034
Held by 28 Schemes (16.06%)
Held by 199 FIIs (12.21%)
Ambadi Investments Limited (38.26%)
Sbi Contra Fund (6.66%)
22.81%
Quarterly Results Snapshot (Consolidated) - Mar'26 - YoY

YoY Growth in quarter ended Mar 2026 is 15.73% vs 22.57% in Mar 2025
YoY Growth in quarter ended Mar 2026 is -216.33% vs 30.05% in Mar 2025
Half Yearly Results Snapshot (Consolidated) - Sep'25

Growth in half year ended Sep 2025 is 26.57% vs -0.05% in Sep 2024
Growth in half year ended Sep 2025 is 68.96% vs -29.26% in Sep 2024
Nine Monthly Results Snapshot (Consolidated) - Dec'25
YoY Growth in nine months ended Dec 2025 is 23.64% vs 3.95% in Dec 2024
YoY Growth in nine months ended Dec 2025 is 52.55% vs -12.88% in Dec 2024
Annual Results Snapshot (Consolidated) - Mar'26
YoY Growth in year ended Mar 2026 is 21.91% vs 7.46% in Mar 2025
YoY Growth in year ended Mar 2026 is -35.16% vs -2.37% in Mar 2025
About EID Parry (India) Ltd

Company Coordinates


