
Compare Sterlite Tech. with Similar Stocks
Dashboard
Weak Long Term Fundamental Strength with a -12.92% CAGR growth in Operating Profits over the last 5 years
- Low ability to service debt as the company has a high Debt to EBITDA ratio of 3.37 times
- The company has been able to generate a Return on Equity (avg) of 2.63% signifying low profitability per unit of shareholders funds
With a growth in Operating Profit of 68.99%, the company declared Very Positive results in Mar 26
With ROCE of 6.8, it has a Very Expensive valuation with a 7.8 Enterprise value to Capital Employed
High Institutional Holdings at 22.31%
Stock DNA
Telecom - Equipment & Accessories
INR 29,912 Cr (Small Cap)
525.00
49
0.00%
0.71
2.39%
12.56
Total Returns (Price + Dividend) 
Latest dividend: 0.7469 per share ex-dividend date: Aug-08-2023
Risk Adjusted Returns v/s
Returns Beta

News
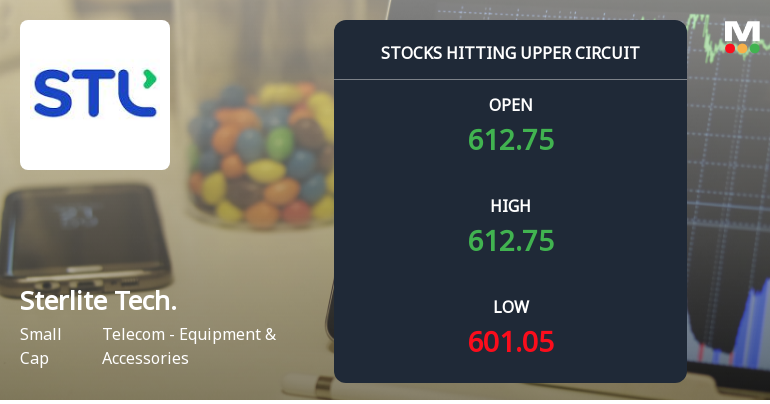
Sterlite Technologies Ltd Locks at Upper Circuit With 5.0% Gain — Buyers Queue, Sellers Absent
At Rs 613.35, the buying was done — not because demand dried up, but because the exchange wouldn't let the stock go any higher. Sterlite Technologies Ltd locked at its upper circuit of 5.0% on 25 Jun 2026, with buyers queuing and no sellers willing to part with shares.
Read full news article
Below All Moving Averages and Now at Lower Circuit: Sterlite Technologies Ltd Loses 4.99% in a Single Session
At Rs 592.8, sellers were still queuing — but there were no buyers willing to take the other side. Sterlite Technologies Ltd locked at its lower circuit of 5% on 23 Jun 2026, with unfilled sell orders and a frozen price, signalling persistent selling pressure in a small-cap telecom equipment stock.
Read full news article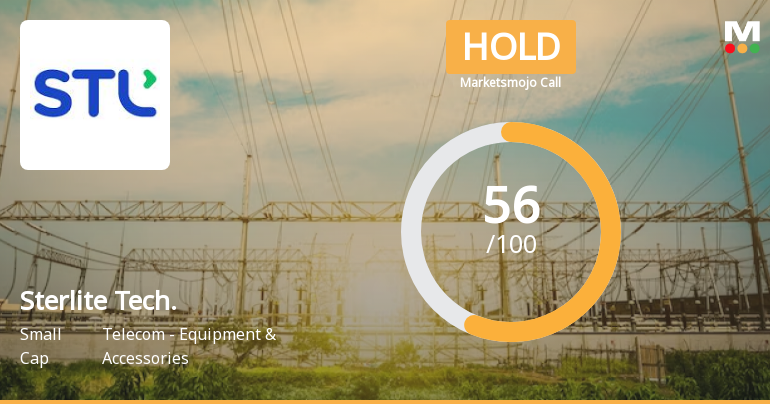
Sterlite Technologies Ltd is Rated Hold by MarketsMOJO
Sterlite Technologies Ltd is rated 'Hold' by MarketsMOJO, with this rating last updated on 16 Feb 2026. However, the analysis and financial metrics discussed here reflect the company’s current position as of 19 June 2026, providing investors with an up-to-date view of its fundamentals, valuation, financial trends, and technical outlook.
Read full news article Announcements
Audited Standalone And Consolidated Financial Statements For The Financial Year Ended March 31 2026
18-Jun-2026 | Source : BSEAudited standalone and consolidated financial statements for the Financial Year ended March 31 2026
Shareholder Meeting / Postal Ballot-Outcome of Postal_Ballot
17-Jun-2026 | Source : BSEDeclaration of Voting Results of Postal Ballot and submission of Scrutinizers Report in accordance with SEBI Listing Regulations.
Announcement under Regulation 30 (LODR)-Credit Rating
17-Jun-2026 | Source : BSEIntimation for upgrade in Credit Rating outlook
Corporate Actions

No Upcoming Board Meetings

Sterlite Technologies Ltd has declared 50% dividend, ex-date: 08 Aug 23

Sterlite Technologies Ltd has announced 2:5 stock split, ex-date: 09 Mar 10

Sterlite Technologies Ltd has announced 1:1 bonus issue, ex-date: 09 Mar 10

No Rights history available
Quality key factors
Valuation key factors
Technicals key factors
 Technical Indicator Scale: Bearish, Mildly Bearish, Sideways, Mildly Bullish, Bullish Turned
 Shareholding Snapshot : Mar 2026
Shareholding Compare (%holding)
Promoters
None
Held by 11 Schemes (7.41%)
Held by 105 FIIs (11.47%)
Twin Star Overseas Ltd (42.9%)
Bandhan Value Fund (4.97%)
25.49%
Quarterly Results Snapshot (Consolidated) - Mar'26 - QoQ

QoQ Growth in quarter ended Mar 2026 is 14.64% vs 21.57% in Dec 2025

QoQ Growth in quarter ended Mar 2026 is 447.06% vs -525.00% in Dec 2025
Half Yearly Results Snapshot (Consolidated) - Sep'25
Growth in half year ended Sep 2025 is 5.55% vs -35.48% in Sep 2024
Growth in half year ended Sep 2025 is 122.58% vs -170.45% in Sep 2024
Nine Monthly Results Snapshot (Consolidated) - Dec'25
YoY Growth in nine months ended Dec 2025 is 12.47% vs -32.13% in Dec 2024
YoY Growth in nine months ended Dec 2025 is 96.51% vs -377.42% in Dec 2024
Annual Results Snapshot (Consolidated) - Mar'26
YoY Growth in year ended Mar 2026 is 18.74% vs -2.13% in Mar 2025
YoY Growth in year ended Mar 2026 is 145.53% vs -141.18% in Mar 2025
About Sterlite Technologies Ltd

Company Coordinates


