
Compare ITI with Similar Stocks
Dashboard
Weak Long Term Fundamental Strength with a -206.42% CAGR growth in Operating Profits over the last 5 years
- Low ability to service debt as the company has a high Debt to EBITDA ratio of 17.55 times
- The company has been able to generate a Return on Equity (avg) of 0.91% signifying low profitability per unit of shareholders funds
Negative results in Mar 26
Risky - Negative Operating Profits
Despite the size of the company, domestic mutual funds hold only 0.61% of the company
Stock DNA
Telecom - Equipment & Accessories
INR 29,617 Cr (Small Cap)
NA (Loss Making)
47
0.00%
0.22
-8.20%
15.58
Total Returns (Price + Dividend) 
ITI for the last several years.
Risk Adjusted Returns v/s
Returns Beta

News

ITI Ltd is Rated Strong Sell by MarketsMOJO
ITI Ltd is rated Strong Sell by MarketsMOJO. This rating was last updated on 19 January 2026, reflecting a change from the previous 'Sell' grade. However, the analysis and financial metrics discussed below represent the company’s current position as of 24 June 2026, providing investors with the latest insights into its performance and outlook.
Read full news article
ITI Ltd Technical Momentum Shifts Amid Mixed Indicator Signals
ITI Ltd, a small-cap player in the Telecom - Equipment & Accessories sector, has recently exhibited a subtle shift in its technical momentum, moving from a sideways trend to a mildly bullish stance. Despite this positive tilt, the stock’s technical indicators present a nuanced picture, with some signals pointing to strength while others suggest caution. This article analyses the latest technical parameters, price momentum, and comparative returns to provide a comprehensive view for investors.
Read full news article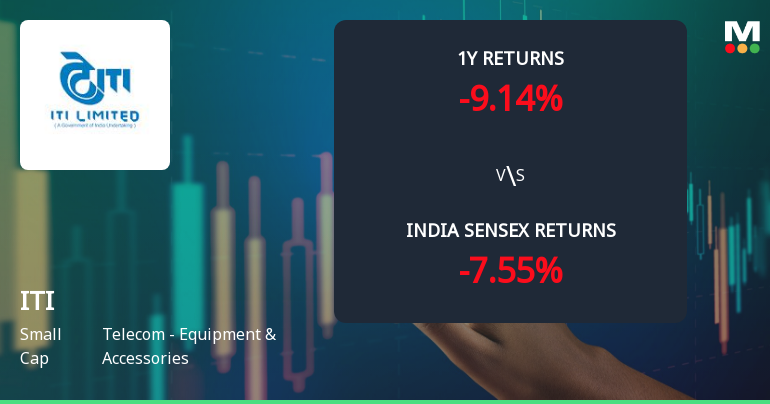
ITI Ltd Technical Momentum Shifts Amid Mixed Market Signals
ITI Ltd has experienced a notable shift in its technical momentum, moving from a mildly bearish stance to a sideways trend, reflecting a complex interplay of bullish and bearish signals across key technical indicators. Despite a recent 3.55% intraday gain, the stock remains under pressure with a MarketsMOJO grade downgraded to Strong Sell, underscoring caution for investors in the telecom equipment sector.
Read full news article Announcements
Announcement under Regulation 30 (LODR)-Newspaper Publication
16-Jun-2026 | Source : BSECopy of Newspaper Publication of Audited Financial Results for the Quarter and Year Ended 31st March 2026.
Announcement under Regulation 30 (LODR)-Newspaper Publication
16-Jun-2026 | Source : BSECopy of Newspaper Publication of Corrigendum to Audited Financial Results for the Quarter and Year Ended 31st March 2026.
Announcement under Regulation 30 (LODR)-Change in Directorate
15-Jun-2026 | Source : BSEExtension of Additional Charge for the post of Director(HR).
Corporate Actions

No Upcoming Board Meetings

No Dividend history available

No Splits history available

No Bonus history available

No Rights history available
Quality key factors
Valuation key factors
Technicals key factors
 Technical Indicator Scale: Bearish, Mildly Bearish, Sideways, Mildly Bullish, Bullish Turned
 Shareholding Snapshot : Mar 2026
Shareholding Compare (%holding)
Promoters
None
Held by 17 Schemes (0.06%)
Held by 8 FIIs (0.01%)
President Of India (89.99%)
Special National Investment Fund (7.88%)
1.9%
Quarterly Results Snapshot (Consolidated) - Mar'26 - YoY

YoY Growth in quarter ended Mar 2026 is -39.98% vs 73.91% in Mar 2025

YoY Growth in quarter ended Mar 2026 is 10,056.62% vs 98.17% in Mar 2025
Half Yearly Results Snapshot (Consolidated) - Sep'25
Growth in half year ended Sep 2025 is -32.21% vs 280.70% in Sep 2024
Growth in half year ended Sep 2025 is 27.03% vs 29.36% in Sep 2024
Nine Monthly Results Snapshot (Consolidated) - Dec'25
YoY Growth in nine months ended Dec 2025 is -39.47% vs 288.12% in Dec 2024
YoY Growth in nine months ended Dec 2025 is 31.94% vs 36.22% in Dec 2024
Annual Results Snapshot (Consolidated) - Mar'26
YoY Growth in year ended Mar 2026 is -39.62% vs 186.19% in Mar 2025
YoY Growth in year ended Mar 2026 is 236.27% vs 62.23% in Mar 2025
About ITI Ltd

Company Coordinates


