
Compare HFCL with Similar Stocks
Dashboard
Strong ability to service debt as the company has a low Debt to EBITDA ratio of 2.29 times
With a growth in Net Sales of 127.81%, the company declared Outstanding results in Mar 26
Market Beating performance in long term as well as near term
With its market cap of Rs 32,564 cr, it is the second biggest company in the sector (behind Indus Towers)and constitutes 14.69% of the entire sector
Stock DNA
Telecom - Equipment & Accessories
INR 32,707 Cr (Small Cap)
104.00
21
0.04%
0.25
6.37%
6.66
Total Returns (Price + Dividend) 
Latest dividend: 0.1 per share ex-dividend date: Sep-08-2025
Risk Adjusted Returns v/s
Returns Beta

News
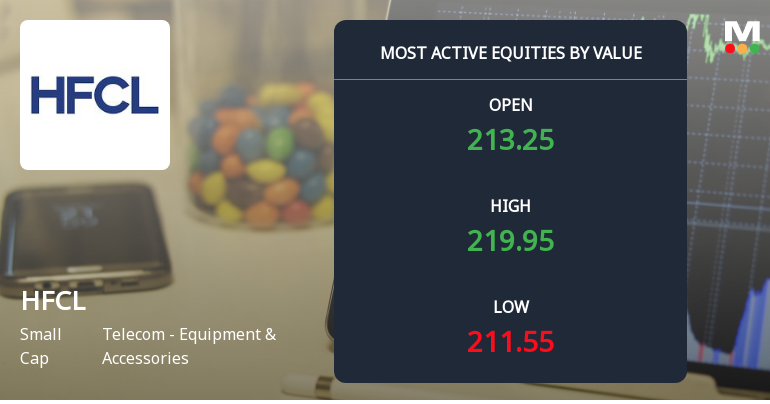
HFCL Ltd Sees Robust Trading Activity Amid Upgraded Buy Rating
HFCL Ltd, a prominent player in the Telecom Equipment & Accessories sector, has emerged as one of the most actively traded stocks by value on 30 June 2026. The company’s shares witnessed a significant surge in trading volume and value, supported by strong institutional participation and a recent upgrade in its MarketsMOJO Mojo Grade from Hold to Buy. This renewed investor confidence has propelled HFCL close to its 52-week high, outperforming both its sector and the broader Sensex index.
Read full news article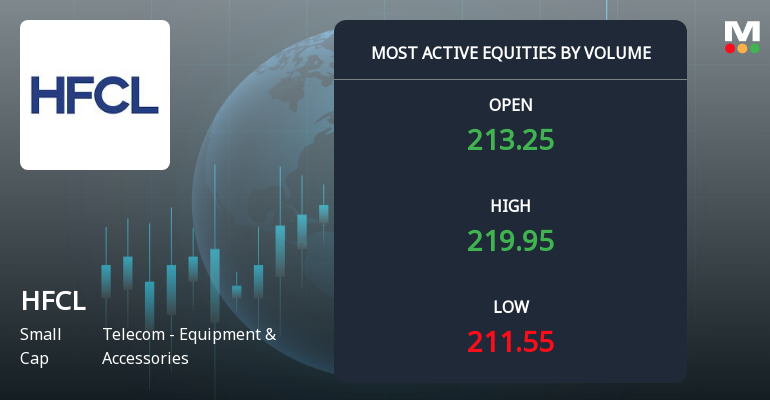
HFCL Ltd Sees Exceptional Volume Surge Amid Strong Market Outperformance
HFCL Ltd, a prominent player in the Telecom - Equipment & Accessories sector, witnessed a remarkable surge in trading volume on 30 June 2026, signalling heightened investor interest and robust market activity. The stock outperformed its sector peers and broader indices, supported by strong accumulation signals and positive momentum indicators.
Read full news article
Below All Moving Averages and Now at Lower Circuit: HFCL Ltd Loses 4.76% in a Single Session
At Rs 204.76, sellers were still queuing — but there were no buyers willing to take the other side. HFCL Ltd locked at its lower circuit of 5% on 29 Jun 2026, with unfilled sell orders and a frozen price, signalling a day dominated by selling pressure and limited demand.
Read full news article Announcements
HFCL Limited - Analysts/Institutional Investor Meet/Con. Call Updates
03-Dec-2019 | Source : NSEHFCL Limited has informed the Exchange regarding Analysts/Institutional Investor Meet/Con. Call Updates
HFCL Limited - Analysts/Institutional Investor Meet/Con. Call Updates
15-Nov-2019 | Source : NSEHFCL Limited has informed the Exchange regarding Analysts/Institutional Investor Meet/Con. Call Updates, Transcript of Conference Call on Financial Results/ Earnings for the quarter and half year ended 30th September, 2019
HFCL Limited - Press Release
23-Oct-2019 | Source : NSEHFCL Limited has informed the Exchange regarding a press release dated October 22, 2019, titled "Press Release on the Un-audited Financial Results of the Company for
Corporate Actions

No Upcoming Board Meetings

HFCL Ltd has declared 10% dividend, ex-date: 08 Sep 25

No Splits history available

No Bonus history available

No Rights history available
Quality key factors
Valuation key factors
Technicals key factors
 Technical Indicator Scale: Bearish, Mildly Bearish, Sideways, Mildly Bullish, Bullish Turned
 Shareholding Snapshot : Mar 2026
Shareholding Compare (%holding)
Non Institution
56.9338
Held by 24 Schemes (6.92%)
Held by 140 FIIs (7.08%)
Mn Ventures Private Limited (13.92%)
Quant Mutual Fund - Quant Multi Cap Fund (6.54%)
37.37%
Quarterly Results Snapshot (Consolidated) - Mar'26 - YoY

YoY Growth in quarter ended Mar 2026 is 127.81% vs -39.62% in Mar 2025
YoY Growth in quarter ended Mar 2026 is 319.21% vs -173.99% in Mar 2025
Half Yearly Results Snapshot (Consolidated) - Sep'25

Growth in half year ended Sep 2025 is -14.99% vs 6.89% in Sep 2024
Growth in half year ended Sep 2025 is -80.77% vs 34.67% in Sep 2024
Nine Monthly Results Snapshot (Consolidated) - Dec'25
YoY Growth in nine months ended Dec 2025 is -4.25% vs 3.98% in Dec 2024
YoY Growth in nine months ended Dec 2025 is -48.53% vs 17.79% in Dec 2024
Annual Results Snapshot (Consolidated) - Mar'26
YoY Growth in year ended Mar 2026 is 21.77% vs -8.97% in Mar 2025
YoY Growth in year ended Mar 2026 is 75.72% vs -46.21% in Mar 2025
About HFCL Ltd

Company Coordinates


