
Compare ITI with Similar Stocks
Dashboard
Weak Long Term Fundamental Strength with a -206.42% CAGR growth in Operating Profits over the last 5 years
- Low ability to service debt as the company has a high Debt to EBITDA ratio of 17.55 times
- The company has been able to generate a Return on Equity (avg) of 0.91% signifying low profitability per unit of shareholders funds
Negative results in Mar 26
Risky - Negative Operating Profits
Despite the size of the company, domestic mutual funds hold only 0.61% of the company
Stock DNA
Telecom - Equipment & Accessories
INR 29,107 Cr (Small Cap)
NA (Loss Making)
21
0.00%
0.22
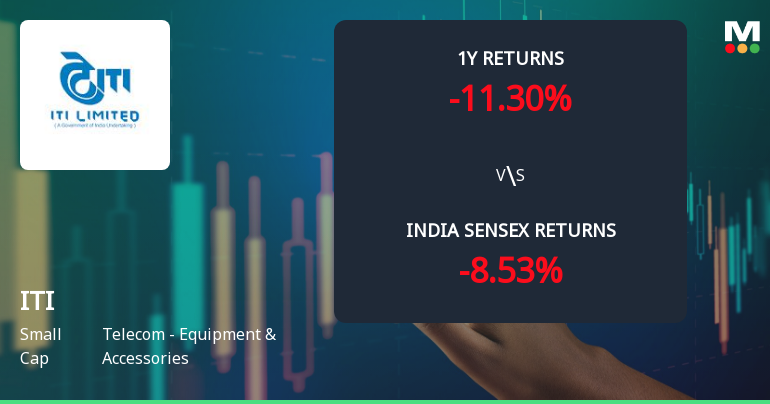
-8.20%
15.13
Total Returns (Price + Dividend) 
ITI for the last several years.
Risk Adjusted Returns v/s
Returns Beta

News
ITI Ltd Technical Momentum Shifts Amid Mixed Indicator Signals
ITI Ltd, a small-cap player in the Telecom Equipment & Accessories sector, has experienced a nuanced shift in its technical momentum, reflecting a complex interplay of bullish and bearish signals across multiple timeframes. Despite a modest daily price increase of 0.74%, the company’s technical indicators and recent rating adjustments suggest caution for investors amid sideways trend developments.
Read full news article
ITI Ltd Technical Momentum Shifts Amid Mixed Indicator Signals
ITI Ltd, a small-cap player in the Telecom - Equipment & Accessories sector, has experienced a notable shift in its technical momentum, moving from mildly bullish to mildly bearish territory. Despite a strong sell rating upgrade by MarketsMOJO, the stock’s technical indicators present a complex picture, with mixed signals from MACD, RSI, moving averages, and other momentum oscillators. This article analyses the recent price action, technical trends, and what these mean for investors navigating the current market environment.
Read full news article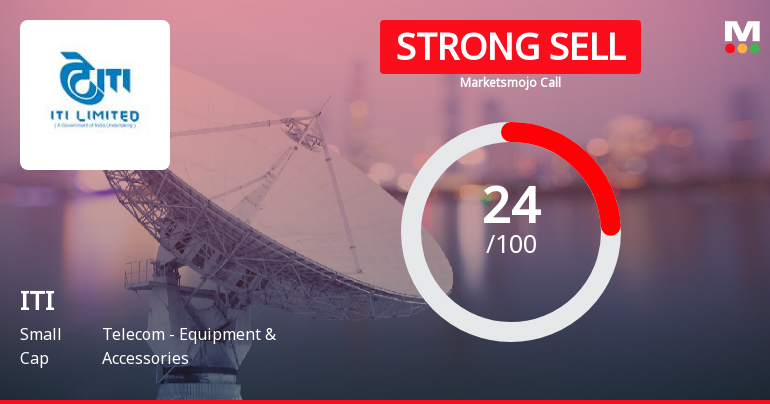
ITI Ltd is Rated Strong Sell by MarketsMOJO
ITI Ltd is rated Strong Sell by MarketsMOJO. This rating was last updated on 19 January 2026, reflecting a change from the previous 'Sell' grade. However, the analysis and financial metrics discussed below represent the company’s current position as of 24 June 2026, providing investors with the latest insights into its performance and outlook.
Read full news article Announcements
ITI Limited - Analysts/Institutional Investor Meet/Con. Call Updates
05-Dec-2019 | Source : NSEITI Limited has informed the Exchange regarding Analysts/Institutional Investor Meet/Con. Call Updates
ITI Limited - Updates
03-Dec-2019 | Source : NSEITI Limited has informed the Exchange regarding 'Extension of Tenure of Shri Chittaranjan Pradhan- Director Finance'.
ITI Limited - Updates
26-Nov-2019 | Source : NSEITI Limited has informed the Exchange regarding 'Intimation on expiry of tenure of Shri Saday Krishna Kanoria, Independent Director'.
Corporate Actions

No Upcoming Board Meetings

No Dividend history available

No Splits history available

No Bonus history available

No Rights history available
Quality key factors
Valuation key factors
Technicals key factors
 Technical Indicator Scale: Bearish, Mildly Bearish, Sideways, Mildly Bullish, Bullish Turned
 Shareholding Snapshot : Mar 2026
Shareholding Compare (%holding)
Promoters
None
Held by 17 Schemes (0.06%)
Held by 8 FIIs (0.01%)
President Of India (89.99%)
Special National Investment Fund (7.88%)
1.9%
Quarterly Results Snapshot (Consolidated) - Mar'26 - YoY

YoY Growth in quarter ended Mar 2026 is -39.98% vs 73.91% in Mar 2025

YoY Growth in quarter ended Mar 2026 is 10,056.62% vs 98.17% in Mar 2025
Half Yearly Results Snapshot (Consolidated) - Sep'25
Growth in half year ended Sep 2025 is -32.21% vs 280.70% in Sep 2024
Growth in half year ended Sep 2025 is 27.03% vs 29.36% in Sep 2024
Nine Monthly Results Snapshot (Consolidated) - Dec'25
YoY Growth in nine months ended Dec 2025 is -39.47% vs 288.12% in Dec 2024
YoY Growth in nine months ended Dec 2025 is 31.94% vs 36.22% in Dec 2024
Annual Results Snapshot (Consolidated) - Mar'26
YoY Growth in year ended Mar 2026 is -39.62% vs 186.19% in Mar 2025
YoY Growth in year ended Mar 2026 is 236.27% vs 62.23% in Mar 2025
About ITI Ltd

Company Coordinates


