
Compare Indus Towers with Similar Stocks
Stock DNA
Telecom - Equipment & Accessories
INR 105,830 Cr (Mid Cap)
15.00
22
0.00%
0.39
18.02%
2.66
Total Returns (Price + Dividend) 
Latest dividend: 11 per share ex-dividend date: May-13-2022
Risk Adjusted Returns v/s
Returns Beta

News
Indus Towers Ltd Downgraded to Sell Amid Technical Weakness and Flat Financials
Indus Towers Ltd, a leading player in the Telecom Equipment & Accessories sector, has seen its investment rating downgraded from Hold to Sell as of 25 June 2026. This revision reflects a combination of deteriorating technical indicators, flat financial performance, and valuation concerns, despite the company’s strong market position and institutional backing.
Read full news article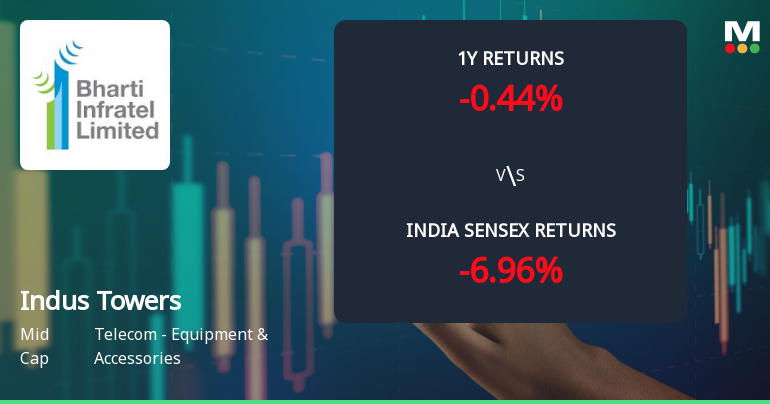
Indus Towers Ltd Technical Momentum Shifts Amid Mixed Market Signals
Indus Towers Ltd has experienced a notable shift in its technical momentum, moving from a mildly bullish stance to a sideways trend, reflecting a complex interplay of bearish and bullish signals across key technical indicators. Despite a recent downgrade in daily price performance, the stock’s medium-term outlook remains nuanced, with mixed signals from MACD, RSI, moving averages, and other momentum oscillators.
Read full news article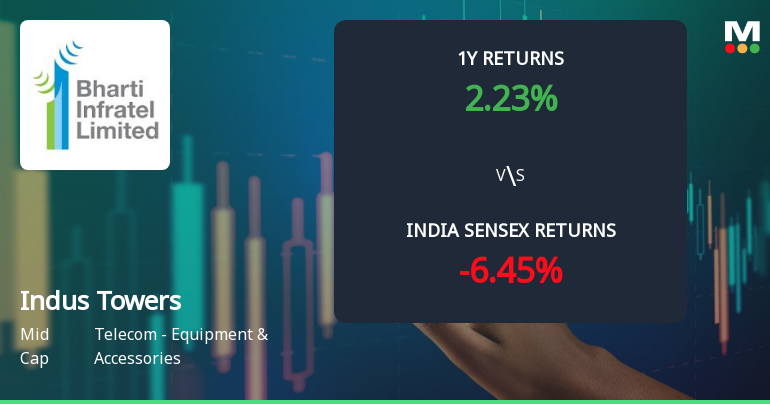
Indus Towers Ltd Technical Momentum Shifts Signal Mildly Bullish Outlook
Indus Towers Ltd has exhibited a notable shift in its technical momentum, moving from a sideways trend to a mildly bullish stance, supported by a mixed but improving set of technical indicators. This transition, coupled with a recent upgrade in its Mojo Grade from Sell to Hold, suggests a cautiously optimistic outlook for the mid-cap telecom equipment player amid a challenging market backdrop.
Read full news article Announcements
Closure of Trading Window
24-Jun-2026 | Source : BSEIndus Towers Limited has informed the Exchange regarding the Trading Window closure pursuant to SEBI (Prohibition of Insider Trading) Regulations 2015
Announcement under Regulation 30 (LODR)-Newspaper Publication
09-Jun-2026 | Source : BSEIndus Towers Limited has informed the Exchange regarding Newspaper Publication of Notice for transferring Equity Shares of the Company to the Demat Account of Investor Education and Protection Fund Authority
Compliances-Reg.24(A)-Annual Secretarial Compliance
30-May-2026 | Source : BSEPlease find enclosed the Annual Secretarial Compliance Report for the financial year ended March 31 2026
Corporate Actions

No Upcoming Board Meetings

Indus Towers Ltd has declared 110% dividend, ex-date: 13 May 22

No Splits history available

No Bonus history available

No Rights history available
Quality key factors
Valuation key factors
Technicals key factors
 Technical Indicator Scale: Bearish, Mildly Bearish, Sideways, Mildly Bullish, Bullish Turned
 Shareholding Snapshot : Mar 2026
Shareholding Compare (%holding)
Promoters
None
Held by 42 Schemes (14.08%)
Held by 826 FIIs (25.09%)
Bharti Airtel Limited (51.26%)
Sbi Arbitrage Opportunities Fund (3.61%)
2.7%
Quarterly Results Snapshot (Consolidated) - Mar'26 - QoQ

QoQ Growth in quarter ended Mar 2026 is -0.56% vs -0.51% in Dec 2025

QoQ Growth in quarter ended Mar 2026 is 0.96% vs -3.45% in Dec 2025
Half Yearly Results Snapshot (Consolidated) - Sep'25
Growth in half year ended Sep 2025 is 9.41% vs 4.50% in Sep 2024
Growth in half year ended Sep 2025 is -13.82% vs 57.02% in Sep 2024
Nine Monthly Results Snapshot (Consolidated) - Dec'25
YoY Growth in nine months ended Dec 2025 is 8.91% vs 4.62% in Dec 2024
YoY Growth in nine months ended Dec 2025 is -34.35% vs 94.89% in Dec 2024
Annual Results Snapshot (Consolidated) - Mar'26
YoY Growth in year ended Mar 2026 is 7.87% vs 5.32% in Mar 2025
YoY Growth in year ended Mar 2026 is -28.06% vs 64.54% in Mar 2025
About Indus Towers Ltd

Company Coordinates


