
Compare J Kumar Infra with Similar Stocks
Stock DNA
Construction
INR 3,713 Cr (Small Cap)
10.00
47
0.81%
-0.02
11.72%
1.11
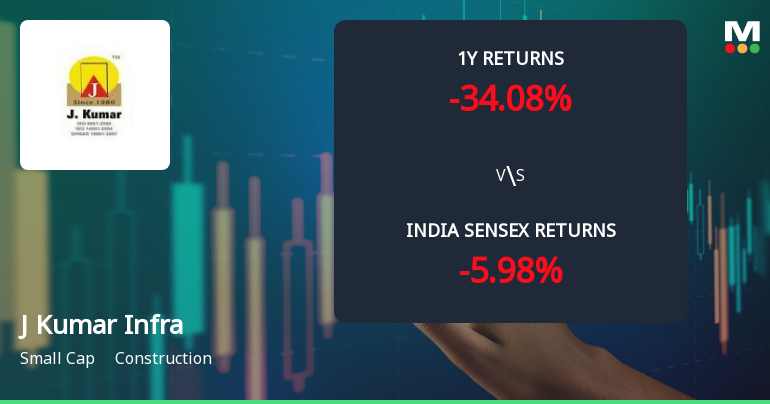
Total Returns (Price + Dividend) 
Latest dividend: 4 per share ex-dividend date: Sep-16-2025
Risk Adjusted Returns v/s
Returns Beta

News
J Kumar Infraprojects Ltd Sees Mixed Technical Signals Amid Price Momentum Shift
J Kumar Infraprojects Ltd has experienced a notable shift in its technical momentum, reflecting a complex interplay of bullish and bearish signals across multiple timeframes. Despite a recent 5.58% surge in daily price, the construction sector stock remains under pressure with a MarketsMOJO Mojo Grade downgrade to Sell, signalling caution for investors amid mixed technical indicators and subdued relative performance against the Sensex.
Read full news article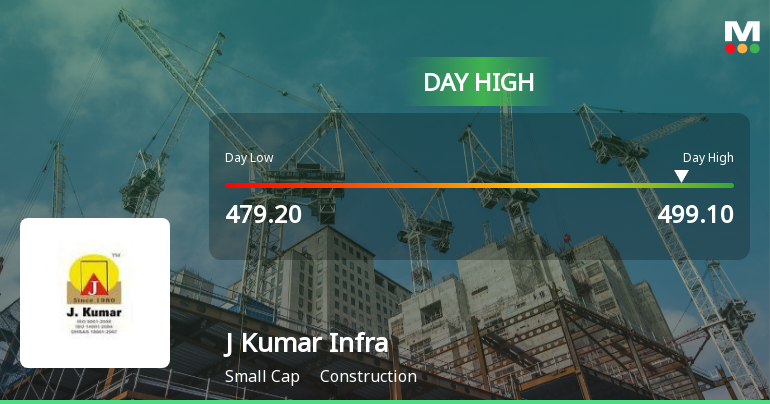
J Kumar Infraprojects Ltd Surges 7.09% to Day's High of Rs 488.75 — Outperforms Sector by 4.01 Percentage Points
The Sensex advanced 1.41% on 15 Jun 2026, yet J Kumar Infraprojects Ltd outpaced the broader market with a 7.09% gain, touching an intraday high of Rs 488.75. This 4.01 percentage-point outperformance over the Construction sector highlights a distinctly stock-specific rally rather than a mere market tailwind.
Read full news article
J Kumar Infraprojects Ltd is Rated Sell
J Kumar Infraprojects Ltd is rated Sell by MarketsMOJO. This rating was last updated on 04 Nov 2025, reflecting a shift from a previous Hold stance. However, the analysis and financial metrics discussed here represent the stock's current position as of 14 June 2026, providing investors with an up-to-date perspective on the company’s performance and outlook.
Read full news article Announcements
Announcement under Regulation 30 (LODR)-Earnings Call Transcript
25-May-2026 | Source : BSETranscript of the Investors Conference Call as held on May 20 2026
Announcement under Regulation 30 (LODR)-Analyst / Investor Meet - Outcome
20-May-2026 | Source : BSEThe Audio recording of the conference call as scheduled on May 20. 2026 on the Audited standalone and consolidated financial result of the company for the fourth quarter and year ended March 312026 is available on the website of the company at www.jkumar.com
Compliances-Reg.24(A)-Annual Secretarial Compliance
20-May-2026 | Source : BSEPlease find enclosed herewith the Annual Secretarial Compliance report of the Company for the Financial Year ended March 31 2026.
Corporate Actions

No Upcoming Board Meetings

J Kumar Infraprojects Ltd has declared 80% dividend, ex-date: 16 Sep 25

J Kumar Infraprojects Ltd has announced 5:10 stock split, ex-date: 10 Dec 15

No Bonus history available

No Rights history available
Quality key factors
Valuation key factors
Technicals key factors
 Technical Indicator Scale: Bearish, Mildly Bearish, Sideways, Mildly Bullish, Bullish Turned
 Shareholding Snapshot : Mar 2026
Shareholding Compare (%holding)
Promoters
22.6662
Held by 4 Schemes (9.42%)
Held by 102 FIIs (12.55%)
Jagdishkumar Madanlal Gupta (14.5%)
Hdfc Trustee Company Ltd. A/c Hdfc Balanced Advantage Fund (8.4%)
16.22%
Quarterly Results Snapshot (Consolidated) - Mar'26 - QoQ

QoQ Growth in quarter ended Mar 2026 is 20.91% vs -2.33% in Dec 2025
QoQ Growth in quarter ended Mar 2026 is 32.34% vs -8.70% in Dec 2025
Half Yearly Results Snapshot (Consolidated) - Sep'25

Growth in half year ended Sep 2025 is 9.81% vs 15.14% in Sep 2024
Growth in half year ended Sep 2025 is 9.58% vs 21.04% in Sep 2024
Nine Monthly Results Snapshot (Consolidated) - Dec'25
YoY Growth in nine months ended Dec 2025 is 1.89% vs 17.56% in Dec 2024
YoY Growth in nine months ended Dec 2025 is -0.05% vs 21.01% in Dec 2024
Annual Results Snapshot (Consolidated) - Mar'26
YoY Growth in year ended Mar 2026 is 0.52% vs 16.69% in Mar 2025
YoY Growth in year ended Mar 2026 is -1.18% vs 18.27% in Mar 2025
About J Kumar Infraprojects Ltd

Company Coordinates


