
Compare J Kumar Infra with Similar Stocks
Stock DNA
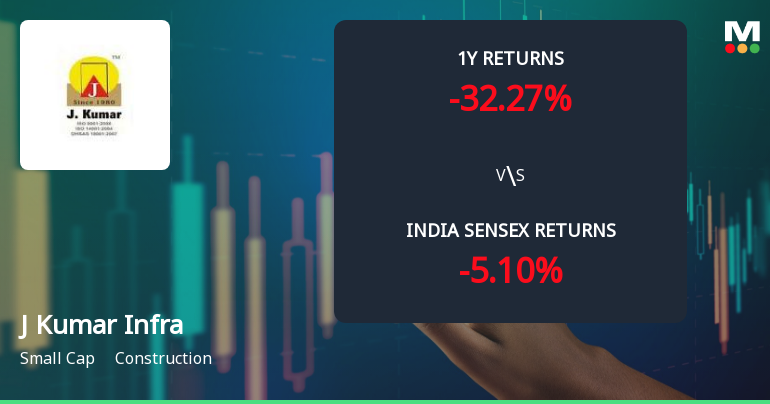
Construction
INR 3,637 Cr (Small Cap)
9.00
43
0.83%
-0.02
11.72%
1.08
Total Returns (Price + Dividend) 
Latest dividend: 4 per share ex-dividend date: Sep-16-2025
Risk Adjusted Returns v/s
Returns Beta

News
J Kumar Infraprojects Ltd Faces Bearish Momentum Amid Technical Downgrade
J Kumar Infraprojects Ltd, a small-cap player in the construction sector, has experienced a notable shift in its technical momentum, prompting a downgrade in its MarketsMOJO grade from Hold to Sell as of 04 Nov 2025. The stock’s recent price action and technical indicators signal a bearish trend, reflecting growing investor caution amid broader market pressures and sectoral challenges.
Read full news articleWhen is the next results date for J Kumar Infraprojects Ltd?
The next results date for J Kumar Infraprojects Ltd is scheduled for 06 August 2026....
Read full news article
J Kumar Infraprojects Ltd is Rated Sell
J Kumar Infraprojects Ltd is rated Sell by MarketsMOJO. This rating was last updated on 04 Nov 2025. However, the analysis and financial metrics presented here reflect the company’s current position as of 28 July 2026, providing investors with an up-to-date view of its fundamentals, returns, and market performance.
Read full news article Announcements
Board Meeting Intimation for Approval Of The Unaudited Financial Results (Standalone And Consolidated) Of The Company For The Quarter Ended June 30 2026
27-Jul-2026 | Source : BSEJ. Kumar Infraprojects Ltdhas informed BSE that the meeting of the Board of Directors of the Company is scheduled on 06/08/2026 inter alia to consider and approve the unaudited financial results (standalone and consolidated) of the Company for the Quarter ended June 30 2026
Compliances-Certificate under Reg. 74 (5) of SEBI (DP) Regulations 2018
10-Jul-2026 | Source : BSEPlease find enclosed herewith a Certificate under Regulation 74(5) of the SEBI (DP) Regulations 2018 for the quarter ended as on June 30 2026.
Announcement under Regulation 30 (LODR)-Newspaper Publication
03-Jul-2026 | Source : BSEPlease find enclosed herewith the copy of newspaper publication as made by the Company in The Financial Express (English language) and Mumbai Lakshadeep (Marathi language) for the Transfer of Equity Shares of the Company to Investor Education and Protection Fund
Corporate Actions

06 Aug 2026

J Kumar Infraprojects Ltd has declared 80% dividend, ex-date: 16 Sep 25

J Kumar Infraprojects Ltd has announced 5:10 stock split, ex-date: 10 Dec 15

No Bonus history available

No Rights history available
Quality key factors
Valuation key factors
Technicals key factors
 Technical Indicator Scale: Bearish, Mildly Bearish, Sideways, Mildly Bullish, Bullish Turned
 Shareholding Snapshot : Jun 2026
Shareholding Compare (%holding)
Promoters
22.6662
Held by 4 Schemes (9.53%)
Held by 88 FIIs (11.68%)
Jagdishkumar Madanlal Gupta (14.5%)
Hdfc Trustee Company Ltd. A/c Hdfc Balanced Advantage Fund (8.4%)
17.14%
Quarterly Results Snapshot (Consolidated) - Mar'26 - QoQ

QoQ Growth in quarter ended Mar 2026 is 20.91% vs -2.33% in Dec 2025
QoQ Growth in quarter ended Mar 2026 is 32.34% vs -8.70% in Dec 2025
Half Yearly Results Snapshot (Consolidated) - Sep'25

Growth in half year ended Sep 2025 is 9.81% vs 15.14% in Sep 2024
Growth in half year ended Sep 2025 is 9.58% vs 21.04% in Sep 2024
Nine Monthly Results Snapshot (Consolidated) - Dec'25
YoY Growth in nine months ended Dec 2025 is 1.89% vs 17.56% in Dec 2024
YoY Growth in nine months ended Dec 2025 is -0.05% vs 21.01% in Dec 2024
Annual Results Snapshot (Consolidated) - Mar'26
YoY Growth in year ended Mar 2026 is 0.52% vs 16.69% in Mar 2025
YoY Growth in year ended Mar 2026 is -1.18% vs 18.27% in Mar 2025
About J Kumar Infraprojects Ltd

Company Coordinates


